


In this article, I will outline why I think Taiwan Semiconductor Manufacturing (NYSE:TSM) offers investors an excellent entry point. I will also outline a stop loss, a price target, and offer an idea of how to know how many shares to buy. I will be using a price chart to outline my thesis. Let’s look at Chart 1 below.
Chart 1 – TSM Weekly Price Chart with 30-Week Moving Average, PPO, Volume, and Relative Strength
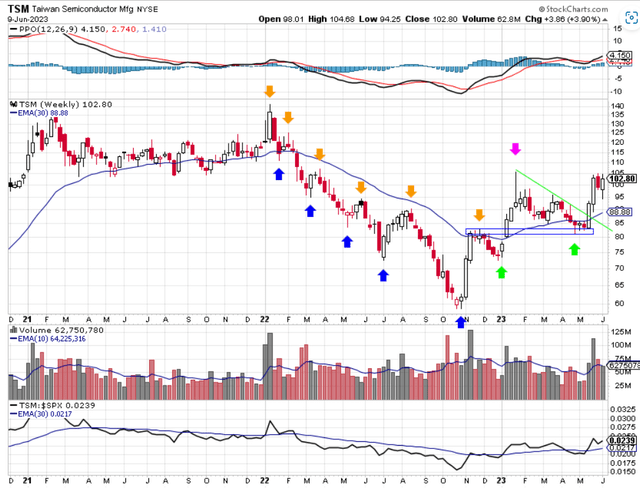
www.stockcharts.com
Whenever I analyze a price chart to identify a stock, the first thing I look at is its price action. I try to determine if the stock is acting bullishly or bearishly. Looking at the second pane in Chart 1 you can see the weekly price chart of TSM going back 2.5 years. The blue line shows the 30-week exponential moving average which is used to determine an intermediate to long term timeframe analysis. Prior to 2022, TSM spent most of its time above the 30-week moving average (MA). This indicates a stock in a bullish condition. This bullish condition changed after the top in January 2002 at roughly $140. From there TSM made a series of lower highs (downward pointing orange arrows) and lower lows (upward pointing blue arrows). This is the textbook definition of a downtrend. TSM closed below its 30-week MA in February and stayed below that MA for the next nine months. All in all, TSM lost over 58% from January 2022 to late October 2022. Bearish conditions don’t last forever, and you can see the price action change to bullish in late 2022. From the low in late October, TSM rallied back to its 30-week MA and even managed to pierce that MA a couple of times. Then in December 2022, instead of making another lower low, buyers stepped in and TSM made a higher low shown by the upward pointing green arrow. TSM then recaptured its 30-week MA and made a higher high (downward pointing purple arrow) for the first time in over a year. The subsequent decline was another higher low shown by the second upward pointing green arrow. This tells me that the price action now favors the bulls. Higher highs and higher lows are the textbook definition of an uptrend. Also, note that TSM is back above a now rising 30-week MA. When the 30-week MA is trending higher that is another bullish sign.
I think the price action is bullish. I can also see that momentum for TSM is bullish as well. Looking at the top pane of Chart 1 you can see the Percentage Price Oscillator (PPO). This is a common indicator used to show price momentum. Bullish PPO can be seen two ways. When the black line is above the red line that shows bullish momentum. When the black line is above the centerline or zero-line of the chart that also shows bullish momentum. The most bullish condition is when the black line is above the red line and the black line is also above the centerline of the chart. That is the condition TSM is in now. Momentum is bullish.
Looking at volume in the third pane of Chart 1, I see that volume is bullish. Institutions are buying the stock. Volume four weeks ago when TSM closed back above its 30-week MA was higher than normal and the following week saw even higher volume. When institutions are supporting the stock that is bullish.
The fourth pane in Chart 1 shows the relative strength of TSM compared to the S&P 500 index. When the black line is rising that means that TSM is outperforming the major index. When the line is falling that means that TSM is underperforming the index. I prefer to own stocks that are outperforming the major index. TSM meets this criterion. Since TSM’s low in October 2022, its relative strength has steadily climbed and is now above its 30-week MA for relative strength. The 30-week MA for relative strength is also rising. Another bullish indication.
I like TSM and I think that it offers an excellent entry at current prices. A more cautious buyer could place a buy stop order above $105.88 which was the high of TSM in January 2023. Once TSM clears this area under $106, I think the stock has little resistance going forward and I see a price target of $140 before TSM hits its next level of supply or resistance. Buying at $106 and the price going to $140 offers a 32% return before dividends.
Knowing that my analysis could be wrong, I use stop levels for my trading. This gets me out of a position without going through a major loss of capital. Several stop losses could be used for TSM. TSM closing below the 30-week MA is one choice. A close below the most recent higher low at $81 is another choice. The stop loss I would favor in this setup is a stop loss of $89. This level sits below the low from three weeks ago. This was the candle with the big bullish volume. Since TSM has strong momentum, is above a rising 30-week MA, and has institutional support, this price level should hold. At worst, a buyer at current price could sell a portion of their position at this level and protect the remaining position with a stop at $81. For me, I favor the $89 level as a stop loss.
Now, how much do I invest in TSM, knowing I could be wrong in my analysis and not wanting to lose a large portion of my capital? I use the 2% rule when placing my order. I don’t want to lose more than 2% of my account equity with any one trade. Here is how I use this rule. If my account is valued at $100,000, I don’t want to lose more than 2% of that value on any one trade. Two percent of $100,000 is $2,000 so that is how much I would risk on this TSM trade. If I buy at the current price of $102.80 and I select a stop loss of $89, I would be risking $13.80 per share on my investment. I then take the $13.80 and divide that into my maximum loss threshold of $2,000 to get the maximum number of shares I can buy. In this case it’s 144. I would round that down to 140 to account for slippage. So, my trade would be 140 shares at $102.80 for $14,392.00. If I am stopped out at $89 my total loss for the trade would be: 140 shares at $89 equals $12,460. $14,392 – $12,460 equals $1,932.00. This outcome wouldn’t be great, but it allows me to preserve my capital for the next opportunity.
In summary, TSM has bullish price action, bullish momentum, institutional buying support, and relative strength to the S&P 500 index. A trade at current prices with a stop loss of $89 offers a risk to reward ratio of 1:2.7. This is computed by taking the target price of $140 and subtracting the purchase price of $102.80 to get $37.20. That is the potential reward. Divide that by the risk of $13.80 and you get 2.7. Keep in mind that $140 is just a potential price target. As long as TSM stays above its rising 30-week MA you can feel comfortable staying long TSM. The eventual profit in this trade could astound.
Read the full article here

