
Dear Fellow Investor,
Upslope’s objective is to deliver attractive, equity-like returns with significantly reduced market risk and low correlation versus traditional equity strategies. Q2 was a strong quarter for the Fund on both an absolute and relative basis, owing largely to sharp outperformance during April’s tariff roll-out volatility.
| Upslope Exposure & Returns1 | Benchmark Returns | |||
|---|---|---|---|---|
| AverageNet Long2 | NetReturn | S&P Midcap 400ETF (MDY) | HFRX EquityHedge Index | |
| Q2 2025 | 47% | |||
| YTD 2025 | 42% | |||
| Last 12 Months | 38% | |||
| Since Inception | 34% | |||
| Downside Deviation | 8.7% | 20.4% | 7.8% | |
| Sortino Ratio3 | 0.91 | 0.37 | 0.38 |
|
Note: LPs/clients should always check individual statements for returns, which may vary due to timing, fee schedules and other factors. Since inception returns, downside standard deviation, and Sortino are all annualized figures. 1 Returns prior to June 2023 are for a composite of all separate accounts invested according to Upslope’s long/short strategy. Subsequent returns are for Class A interest in Upslope Partners Fund, LP. See important performance-related details and disclosures in Appendix A. 2 Beta-/delta-adjusted. 3 Calculated as: (Net return since inception – 2.0% risk-free rate) / downside deviation. |
MARKET CONDITIONS – NO FEAR
Q2 saw markets whipsawed in an unprecedentedly deliberate fashion. Markets got slammed when aggressive tariffs were announced. They quickly rebounded when relief extensions were granted and “deals” announced. Then they rebounded some more. Where does that leave us? No one believes harsh tariffs will be widely implemented. This (lack of tariffs) is a good thing, and it is well reflected in markets and valuations. But markets are now extremely frothy.
Despite the exuberant backdrop (which I assume will last awhile longer), it’s hard not to feel as if most levers are being pushed to ten: dangerous government budgets/debt levels, simmering geopolitical risk across multiple continents, uncomfortably high rates, lingering inflation, and around-the-clock promotion of crypto and other speculative “investments” by retail and “professional” investors alike – as well as the U.S. government itself. As a result, financial markets today seem unusually vulnerable to an unexpected shock than the extreme confidence of their participants suggest.
While rubbernecking is hard to resist, I continue to do my best to keep my head down and focus on bottomup opportunities. Recent, notable changes to Upslope’s portfolio included some rotation in the Fund’s overseas longs (exited QinetiQ, DSM Firmenich, and Spirax; purchased Smiths Group) and the addition of a “barbell” position in two advisory/consulting stocks (long both Evercore and FTI Consulting). More on these changes later. Also of note: Holcim (Switzerland-based cement/building materials business), which the Fund purchased at the end of last year, completed the spin of its N. American unit. We promptly exited shares of the spin and reinvested further in “new” Holcim, which is now more focused on Europe.
PORTFOLIO POSITIONING
At quarter-end, gross and beta-adjusted net exposures were 140% and 59%, respectively. Positioning reflects an above average number of perceived opportunities on both (long + short) sides of the portfolio.
Exhibit 1: Portfolio Snapshot
| NAME | TICKER | INDUSTRY | HQ | ( |
|---|---|---|---|---|
| Core Longs (24% of Total Gross Exposure) | ||||
| CME Group (CME) Inc. | CMF | Investment Banks/Brokers | United States | $99.1 |
| Hershey Company (HSY) | HSY | Food: Specialty/Candy | United States | 33.6 |
| Teledyne Technologies (TDY) Inc. | TDY | Aerospace & Defense | United States | 24.0 |
| Japan Exchange Group, Inc. (OTCPK:JPXGY), Inc. | 8697-JP | Investment Banks/Brokers | Japan | 10.5 |
| Diploma PLC (OTCPK:DPMAY) | DPLM-LON | Wholesale Distributors | United Kingdom | 9.0 |
| Tactical Longs (32%) | ||||
| Holcim AG (OTCPK:HCMLF) I td | HOI N-SWX | Construction Materials | Switzerland | $40.8 |
| Sandvik AB (OTCPK:SDVKF) | SAND-SF | Trucks/Construction/Farm Machinery | Sweden | 28.5 |
| Smiths Group Plc (OTCPK:SMGZY) | SMIN-LON | Flectrical Products | United Kingdom | 10.5 |
| Evercore Inc (EVR). Class A | EVR | Investment Banks/Brokers | United States | 10.4 |
| MarketAxess (MKTX) Holdings Inc. | MKTX | Investment Banks/Brokers | United States | 84 |
| FTI Consulting (FCN), Inc. | FCN | Miscellaneous Commercial Services | United States | 5.6 |
| Chemring Group PLC (OTCPK:CMGMF) | CHG-LON | Aerospace & Defense | United Kingdom | 2.1 |
| Starter Longs (21%) | ||||
| — | Industrial Machinery | Japan | ||
| — | Integrated Oil | Norway | ||
| — | Internet Software/Services | United States | ||
| — | Medical Specialties | Switzerland | ||
| — | Miscellaneous Commercial Services | United States | ||
| Packaged Software | Israel | |||
| Packaged Software | United States | |||
| Semiconductors | United States | |||
| — | Investment Trusts/Mutual Funds | South Korea | ||
| Shorts (23%) |
| Note: as of 6/30/25 and may change without notice. Positions disclosed/categorized at Upslope’s discretion. Source: Upslope, FactSet (FDS) |
Exhibit 2: Gross Exposure by Market Cap & Geography (Total Portfolio)
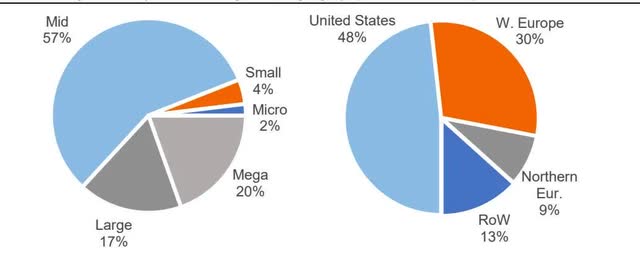
| Note: as of 6/30/25. Market cap ranges: Micro (<$500mm), Small ($500mm – $2bn), Mid ($2bn – $25bn), Large ($25bn – $50bn), Mega (>$50bn). Source: Upslope, Interactive Brokers, FactSet |
PORTFOLIO UPDATES
The largest contributors to and detractors from quarterly performance are noted below. Gross contribution to overall portfolio return is noted in parentheses.
Exhibit 3: Top Contributors to Quarterly Performance (Gross)
| Top Contributors | Top Detractors | |||
|---|---|---|---|---|
| Long: Chemring (+465 bps) | Long: Charles River (-160 bps) | |||
| Long: Diploma (+295 bps) | Long: Undisclosed (-100 bps) | |||
| Long: Holcim (+200 bps) | Short: Index Hedge (-100 bps) | |||
| Longs – Total Contribution | Shorts – Total Contribution | |||
| bps | bps | |||
|
Source: Upslope, Opus Fund Services, Interactive Brokers Note: Amounts may not tie with aggregate performance figures due to rounding. |
Key Longs Exited
QinetiQ Group plc (OTCPK:QNTQF) (QQ-LON, UK test/engineering-focused defense contractor) – reluctantly (shares still appear “cheap”) exited due to continued uneven performance, despite the cyclical boom in defense markets.
DSM-Firmenich (OTC:KDSKF) (DSFIR-NL, specialty ingredients and nutrition co) and Spirax Group (OTCPK:SPXSF) (SPX-LON, provider of steam systems, pumps, and electric thermal solutions for industrial and biopharma applications) – sold both to eliminate lower conviction positions and streamline the portfolio.
Smiths Group (SMIN-LON) – New Long
Smiths is a UK-based industrial conglomerate operating four segments: John Crane (specialty seals/flow control solutions for energy/power and industrials, ~48% of op profit), Flex-Tek (HVAC and industrial specialty tubing, 24%), Smiths Detection (inspection/screening systems for airport and border security, 15%), and Smiths Interconnect (specialty connectors and electronics, 13%).
Historically, Smiths has been perceived by markets as a sleepy, overly diversified conglomerate. Pressured by activist investors (including Elliott, according to the FT) management has committed to drastically simplifying its business by exiting the Interconnect and Detection units (the former to be announced by year-end, the latter next year). Key elements of Upslope’s investment thesis include:
- Attractive core businesses (John Crane + Flex-Tek) that benefit from the “low cost, high importance” nature of their products and strong competitive positions. Although each unit serves reasonably cyclical end markets, they both have a very high (70%+ in the case of John Crane) portion of sales coming from recurring maintenance/aftermarket business. These positive attributes contribute to consistent delivery of mid-20s ROCE and steady mid-single digit organic revenue growth.
- Significant catalysts likely on the horizon with active portfolio reshaping. “Future Smiths” will be a far more nimble, focused business, retaining the company’s most competitively advantaged units.
- Strong capital return program In recent years, Smiths has maintained an active and reasonably aggressive buyback program. From July 2021 (FYE) to Jan 2025 average shares outstanding declined by almost 15%. In January, Smiths added another £350mm (5% of current market cap) to its buyback authorization.
• Reasonable valuation and strong balance sheet – despite near-term catalysts for unlocking value and a stronger-than-usual balance sheet (<0.5x net vs. ~1-2x historically), Smiths trades in-line with its average historical valuation multiples (11x NTM EBITDA, 17x P/E).
Key risks include: delays or failure in portfolio restructuring, cyclical (energy/industrial) downturn, cyber security threats/liabilities (early 2025 incident), and FX (~3/4 of revenue from outside Europe – largely US).
FTI Consulting (FCN) and Evercore (EVR) – New Longs
Upslope has owned FTI Consulting (leader in restructuring and dispute advisory) and Evercore (top independent M&A advisor) in the past. The Fund recently re-initiated positions in each of these companies. While they are bets on polar opposite outcomes (Evercore is very pro-cyclical, while FTI is the most countercyclical publicly traded company I follow), expectations for each appear modest. This was and remains especially true of FTI – although it’s more understandable as the company is going through some turmoil (employee turnover/retention challenges) in one of its non-core segments. Nonetheless, the unique macro environment – on/off trade war, the very pro-cyclical “One Big Beautiful Bill,” lingering inflation, massive regulatory and technological (e.g. AI) uncertainty and change – should ultimately provide significant opportunities for both businesses ahead.
CLOSING THOUGHTS
Given the unusual mix of obvious froth and extreme macro/policy uncertainty, I believe Upslope’s strategy is unusually well positioned for outperformance ahead. Thank you for the trust you’ve placed in me and Upslope to manage a portion of your hard-earned money. Please contact me if you have any questions at all, would like to add to your investment, or know a qualified investor who may be a good fit for Upslope’s unique approach.
Sincerely,
George K. Livadas
Appendix A: Long/Short Strategy Performance (‘net’)
| Jan | Feb | Mar | Apr | May | Jun | Jul | Aug | Sep | Oct | Nov | Dec | YTD | ||
|---|---|---|---|---|---|---|---|---|---|---|---|---|---|---|
| 2025 | Upslope | 2.9% | 6.8% | 0.3% | 1.7% | — | — | 3.4% | ||||||
| S&P Midcap 400 | 3.7% | (4.2%) | (5.5%) | 5.4% | 3.6% | — | — | |||||||
| 2024 | Upslope | 0.1% | 2.3% | 3.0% | 0.9% | 1.5% | 8.1% | 7.1% | 0.3% | 9.4% | ||||
| S&P Midcap 400 | 5.9% | 5.6% | 4.5% | 5.8% | 1.1% | 8.9% | 13.6% | |||||||
| 2023 | Upslope | 1.6% | 2.2% | (3.5%) | 0.1% | 0.3% | 2.4% | 6.6% | 6.1% | 12.4% | ||||
| S&P Midcap 400 | 9.3% | (3.2%) | 9.2% | 4.1% | (5.3%) | 8.4% | 8.6% | 16.1% | ||||||
| 2022 | Upslope | (2.3%) | 0.8% | 1.3% | 3.1% | (1.5%) | 1.5% | (2.3%) | 3.0% | 5.7% | 2.1% | 6.5% | ||
| S&P Midcap 400 | 1.1% | 1.3% | 0.8% | 10.9% | 10.5% | 6.0% | (13.3%) | |||||||
| 2021 | Upslope | 0.3% | 3.2% | 2.4% | 0.4% | 2.4% | 1.6% | 3.9% | 2.9% | 4.2% | ||||
| S&P Midcap 400 | 1.4% | 6.8% | 4.9% | 4.3% | 0.2% | 0.3% | 2.0% | 5.9% | 5.2% | 24.6% | ||||
| 2020 | Upslope | 0.0% | (2.3%) | 0.4% | 4.9% | 1.9% | 4.6% | 0.8% | 3.2% | 3.6% | 0.9% | 15.1% | ||
| S&P Midcap 400 | (2.6%) | 14.1% | 7.2% | 1.3% | 4.7% | 3.5% | (3.3%) | 2.2% | 14.3% | 6.5% | 13.5% | |||
| 2019 | Upslope | 3.8% | 1.0% | 2.4% | 2.6% | 3.0% | 2.1% | 0.7% | 7.2% | 0.7% | 18.9% | |||
| S&P Midcap 400 | 10.3% | 4.3% | 4.0% | 7.8% | 3.1% | 1.1% | 2.9% | 2.8% | 25.8% | |||||
| 2018 | Upslope | 1.6% | 5.5% | 0.4% | 2.0% | 1.2% | 1.0% | 4.6% | ||||||
| S&P Midcap 400 | 2.8% | 1.0% | 4.1% | 1.7% | 3.2% | 3.2% | (11.3%) | |||||||
| 2017 | Upslope | 7.5% | 0.7% | 4.0% | 2.6% | 2.3% | 0.1% | 1.7% | 0.5% | 16.2% | ||||
| S&P Midcap 400 | 1.6% | 2.6% | 0.8% | 1.5% | 0.9% | (1.5%) | 3.9% | 2.2% | 3.7% | 0.2% | 15.9% | |||
| 2016 | Upslope | — | – | 0.0% | 2.7% | (1.6%) | ||||||||
| S&P Midcap 400 | — | (2.7%) | 7.9% | 2.2% | 6.2% |
| Annualized Return l | Total Return. | Downside Dev. | Sortino Ratio | Corr. vs Upslope | ||
|---|---|---|---|---|---|---|
| Since | Upslope | 9.9% | 130.8% | 8.7% | 0.91 | |
| Inception | S&P Midcap 400 | 9.5% | 122.3% | 20.4% | 0.37 | 0.32 |
| HFRX Equity Hedge Index | 5.0% | 53.8% | 7.8% | 0.38 | 0.24 |
|
Source: Upslope, Interactive Brokers, Opus Fund Services, LICCAR, FactSet, Sentieo, Morningstar. Notes: Returns from inception to May 2023 shown for composite of all separate accounts invested according to Upslope’s core long/short strategy. Returns from June 2023 onward shown for Class A interest in Upslope Partners Fund, LP. Performance for a composite of all accounts managed by Upslope from inception is available upon request. Performance for S&P Midcap 400 represented by total return for related exchange-traded fund (ticker: MDY). Individual investment performance may vary. Investors should always review statements for actual results. Data from inception (August 29, 2016) to June 24, 2017 based on portfolio manager’s (“PM”) performance managing the strategy under a prior firm (as sole PM). Thereafter, PM managed the strategy/accounts on a no-fee basis through August 11, 2017, after which Upslope became operational. PAST PERFORMANCE IS NO GUARANTEE OF FUTURE RESULTS. |
Appendix B: Portfolio Company (Long) Descriptions
Chemring (CHG-LON): Niche, UK-based defense contractor focused on defensive flares, specialty explosives and cyber warfare. Setup for shares includes undemanding valuation, accelerating sector tailwinds, clean balance sheet, strategic assets, and an active buyback.
CME Group (CME): Leading operator of global derivatives exchanges; focused on rates, commodities, equities and FX. Attractive, durable business that should continue to benefit from global macro volatility. Competitive threat from upstart exchange continues to dissipate.
Diploma (DPLM-LON): U.K.-based specialty distributor focused on essential consumable products across life sciences, seals (machinery), and controls (aerospace wiring/harnesses). Unique model and conservative M&A strategy have historically enabled attractive free cash flow growth through the cycle.
Evercore (EVR): Leading independent, boutique investment bank focused largely on M&A and other corporate financial advisory. After a few lackluster years, expectations for shares became relatively modest, despite signs of pent-up demand and a potential resurgence in advisory activity.
FTI Consulting (FCN): Boutique consulting and advisory firm, with deep experience in restructuring, dispute/conflict advisory, and other practices. Challenges in a non-core segment have depressed expectations for shares despite an environment that should ultimately lead to strong and rising demand.
Hershey Foods (HSY): Dominant North American chocolate and salty snack business facing “headline” pressures due to recent surge in cocoa prices and GLP-1 worries. Likely overblown fears have allowed for a seemingly attractive entry price in advance of potential share gains and harvesting of recently elevated investment spend.
Holcim (HOLN-SWX): Switzerland-based, global cement, aggregates and building materials company. Anticipate pending (Q2 2025) spin-off of U.S. operations will unlock shareholder value and that European operations should perform well as war in Ukraine eventually winds down.
Japan Exchange Group (8697-JP): Largest exchange operator in Japan with exposure to equities, derivatives, and information services. Key driver and beneficiary of ongoing efforts to reform Japanese equity market structure and corporate governance standards – as well as ongoing global market volatility.
MarketAxess (MKTX): Challenged member of fixed income/credit “exchange” duopoly. Given macro/geopolitical backdrop and depressed valuation, company appears likely to stabilize market share (or better) in the near-term and/or be acquired by a large exchange in the medium-term.
Sandvik (SAND-SE): Sweden-based provider of mining, metal-cutting, and other industrial equipment and tools. Dominant share in mining equipment and outsized exposure to gold miners, combined with modest valuation and elevated gold prices make for an attractive outlook.
Smiths Group (SMIN-LON): Historically sleepy UK-based industrial conglomerate focused on specialty industrial niches and security/detection. Recent activist pressure has led management to commit to transforming the business by shedding non-core units and focusing on the strongest legacy segments.
Teledyne Tech. (TDY): Producer of specialty electronics, components, and technologies – primarily focused on imaging sensors and cameras. Dinged by transformative 2021 FLIR acquisition, expectations and valuation have been reset, balance sheet is clean, and the company is positively exposed to reshoring trends and rising defense spending.
Appendix C: TerminologyCore Longs: Higher “quality” businesses (defined as low cyclicality, clean balance sheet, obvious and durable competitive advantages) managed with less valuation sensitivity (i.e. typically won’t exit a Core long solely because of valuation) and assuming a multi-year time horizon. Tactical Longs: Traditional “value” investments of more modest quality (reasonably or very cyclical, currently experiencing operational, competitive or financial challenges) managed with greater valuation sensitivity (i.e. typically begin to exit if shares approach full valuation) and assuming a shorter time horizon (typically 6-18 months). Starter Longs: Generally smaller, undisclosed longs that fall into at least one of the following groups:
Alpha Shorts: Individual company short positions. Hedges: Diversified index hedges (either long or short). IMPORTANT DISCLOSURES GeneralUpslope Capital Management, LLC (“Upslope”) is a Colorado registered investment adviser. Information presented is for discussion and educational purposes only. This presentation is not an offer to sell securities of any investment fund or a solicitation of offers to buy any such securities. Securities of the fund managed by Upslope are offered to selected investors only by means of a complete offering memorandum and related subscription materials which contain significant additional information about the terms of an investment in the fund (such documents, the “Offering Documents”). Any decision to invest must be based solely upon the information set forth in the Offering Documents, regardless of any information investors may have been otherwise furnished, including this presentation. Investments involve risk and, unless otherwise stated, are not guaranteed. The information in this presentation was prepared by Upslope and is believed by Upslope to be reliable and has been obtained from public sources believed to be reliable. Upslope makes no representation as to the accuracy or completeness of such information. Opinions, estimates and projections in this presentation constitute the current judgment of Upslope and are subject to change without notice. Any projections, forecasts and estimates contained in this presentation are necessarily speculative in nature and are based upon certain assumptions. It can be expected that some or all of such assumptions will not materialize or will vary significantly from actual results. Accordingly, any projections are only estimates and actual results will differ and may vary substantially from the projections or estimates shown. This presentation is not intended as a recommendation to purchase or sell any commodity or security. Upslope has no obligation to update, modify or amend this presentation or to otherwise notify a reader thereof in the event that any matter stated herein, or any opinion, project on, forecast or estimate set forth herein, changes or subsequently becomes inaccurate. The graphs, charts and other visual aids are provided for informational purposes only. None of these graphs, charts or visual aids can and of themselves be used to make investment decisions. No representation is made that these will assist any person in making investment decisions and no graph, chart or other visual aid can capture all factors and variables required in making such decisions. This presentation is strictly confidential and may not be reproduced or redistributed in whole or in part nor may its contents be disclosed to any other person without the express consent of Upslope. Investment StrategyThe description herein of the approach of Upslope and the targeted characteristics of its strategies and investments is based on current expectations and should not be considered definitive or a guarantee that the approaches, strategies, and investment portfolio will, in fact, possess these characteristics. In addition, the description herein of the fund’s risk management strategies is based on current expectations and should not be considered definitive or a guarantee that such strategies will reduce all risk. These descriptions are based on information available as of the date of preparation of this document, and the description may change over time. Past performance of these strategies is not necessarily indicative of future results. There is the possibility of loss and all investment involves risk including the loss of principal. The investment targets described in this presentation are subject to change. Upslope may at any time adjust, increase, decrease or eliminate any of the targets, depending on, among other things, conditions and trends, general economic conditions and changes in Upslope’s investment philosophy, strategy and expectations regarding the focus, techniques, and activities of its strategy. PortfolioThe investments or portfolio companies mentioned, referred to, or described are not representative of all investments in vehicles or SMAs managed by Upslope and there can be no assurance that the investments will be profitable or that other investments made in the future will have similar characteristics or results. Past performance of Upslope’s investment vehicles, investments, or investment strategies are not necessarily indicative of future results. Investors should be aware that a loss of investment is possible. No representation is being made that similar profits or losses will be achieved. Performance ResultsPerformance results presented are for information purposes only and reflect the impact that material economic and market factors had on the manager’s decision-making process. No representation is being made that any investor or portfolio will or is likely to achieve profits or losses similar to those shown. Performance results are shown for the Fund’s Class A interests net of all fees, including management and incentive, Fund operating expenses, as well as all trading costs charged by the custodian, to the investor. Historical SMA composite performance calculations (inception – May 2023) have been independently verified by LICCAR, LLC. Subsequent returns based on Fund performance data from Opus Fund Services. Performance of individual investors may vary based upon differing management fee and incentive allocation arrangements, the timing related to additional client deposits or withdrawals and the actual deployment and investment of a client portfolio, the length of time various positions are held, the client’s objectives and restrictions, and fees and expenses incurred by any specific individual portfolio. Performance estimates are subject to future adjustment and revision. The information provided is historical and is not a guide to future performance. Investors should be aware that a loss of investment is possible. This presentation cannot and does not guarantee or predict a similar outcome with respect to any future investment. Upslope makes no implications, warranties, promises, suggestions or guarantees whatsoever, in whole or in part, that by participating in any investment of or with Upslope you will experience similar investment results and earn any money whatsoever. Indices ComparisonsReferences to market or composite indices, benchmarks, or other measures of relative market performance over a specified period of time are provided for information only. Reference or comparison to an index does not imply that the portfolio will be constructed in the same way as the index or achieve returns, volatility, or other results similar to the index. Indices are unmanaged, include the reinvestment of dividends and do not reflect transaction costs or any performance fees. Unlike indices, Upslope’s investments will be actively managed and may include substantially fewer and different securities than those comprising each index. Upslope’s performance results as compared to the performance of HFRX Equity Hedge Index and S&P Midcap 400 (ticker: MDY) are for informational purposes only. HFRX Equity Hedge Index is an index that maintains positions both long and short in primarily equity and equity derivative securities. S&P Midcap 400 (ticker: MDY) is a stock market index that serves as a gauge for the U.S. mid-cap equities sector. The investment program of Upslope does not mirror the indices and the volatility may be materially different than the volatility of the indices. Direct comparisons between Upslope’s performance and the aforementioned indices are not without complications. The indices may be unmanaged, may be market weighted, and indices do not incur fees and expenses. Due to the differences among the portfolios of Upslope and the aforementioned indices, no such index is directly comparable to Upslope. Fund TermsThe summary provided herein of the terms and conditions of the fund managed by Upslope does not purport to be complete. The fund’s Offering Documents should be read in its entirety prior to an investment in the fund. |
Original Post
Editor’s Note: The summary bullets for this article were chosen by Seeking Alpha editors.
Editor’s Note: This article discusses one or more securities that do not trade on a major U.S. exchange. Please be aware of the risks associated with these stocks.
Read the full article here

