A few months ago, I reviewed the WisdomTree U.S. High Dividend Fund ETF (NYSEARCA:DHS) with the conclusion that the DHS ETF was outperforming at the time due to its elevated energy exposures. I warned:
DHS’s complex index methodology produces these lopsided sector bets, which makes the DHS ETF either a ‘hero or a zero’ in any given year, depending if its sector bets are in favour. For investors who are bullish on energy, the DHS may be a good near-term trade. However, I personally prefer a more consistent methodology and performance when it comes to dividend investing.
Unfortunately for DHS unitholders, since my article was published, the DHS ETF’s performance has definitely not been a ‘hero’, returning -10.3% in price and -8.5% in total returns compared to the S&P 500, which returned +4.2% in the same time frame (Figure 1).
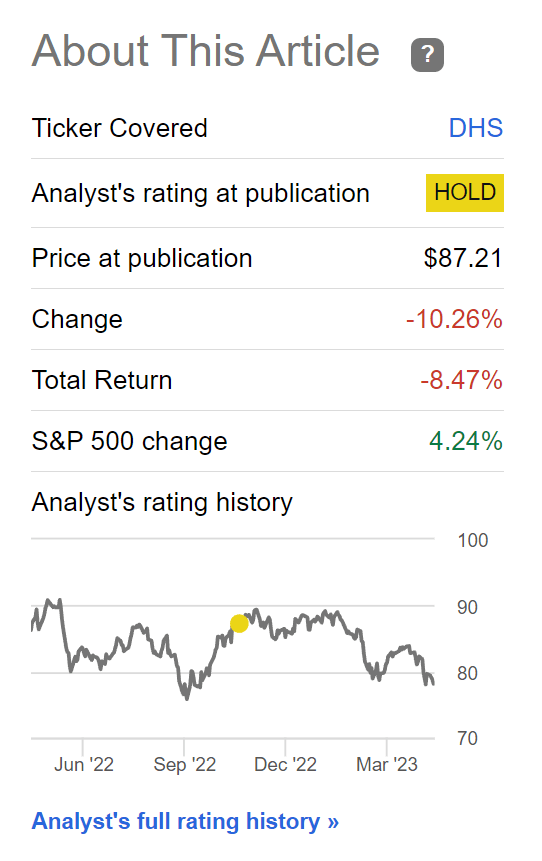
Figure 1 – DHS has returned -8.5% since my prior article (Seeking Alpha)
With roughly half a year since my prior article, let us review why DHS has underperformed in the past 6 months and what I see in the outlook for the future.
Brief Fund Overview
First, let us go through a brief review of the DHS ETF’s strategy, for those who are not familiar with the details or cannot understand the ETF’s convoluted composition rules. The DHS ETF tracks the WisdomTree U.S. High Dividend Index (“Index”).
From an initial universe of all U.S. companies, the index first screens for companies that have market cap greater than $200 million and daily trading volumes greater than $200,000. ADRs, MLPs, BDCs, and royalty trusts are excluded from the index but common stocks, REITs, and tracking stocks are included.
Next, companies are assigned a composite risk score that weighs quality factors like ROA, ROE, gross profits, cash flows, and momentum. Companies that rank in the top 5% by dividend yield and bottom half by composite risk scores are also excluded from further consideration.
Finally, companies are ranked by their annual dividend yields, with the top 30% by indicated yield selected for inclusion. The index weighing mechanism magnifies the effect of dividends to be paid in the coming year as it weighs stocks using the proportionate share of each company’s dollar dividend value relative to the aggregate expected cash dividends of all index constituents.
Individual company weights are capped at 5%, and a further sector weight cap of 25% (except for Real Estate, which is capped at 5%) is applied. Excess weights are rebalanced to other index members.
Dividend Focus Leads To Big Sector Bets
The DHS fund’s myopic focus on dividends leads to large sector bets. For example, in my prior article, I noted that the fund had a 22.5% weight in Energy, 20.4% weight in Healthcare, 16.8% weight in Consumer Staples, and 13.8% weight in Financials. Information Technology and Consumer Discretionary stocks were almost nonexistent in the portfolio (Figure 2).
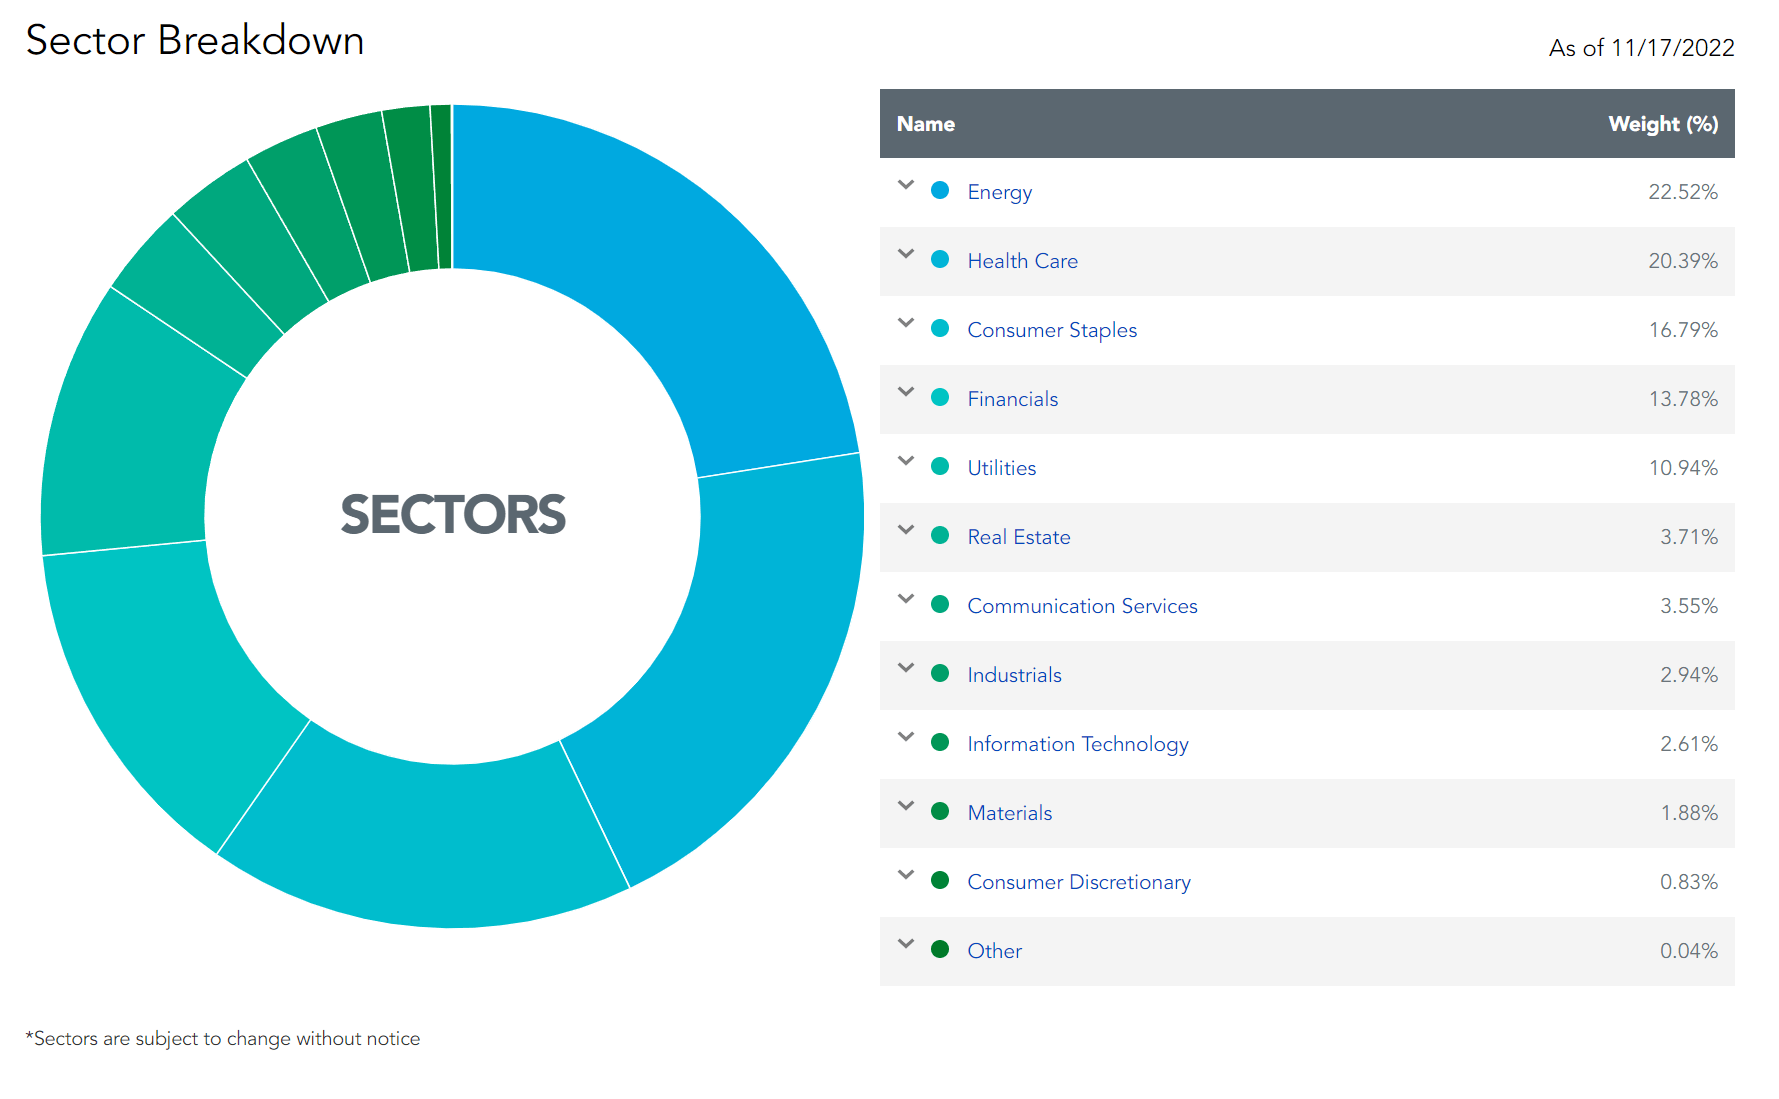
Figure 2 – DHS sector weights as of November 2022 (wisdomtree.com)
When the fund’s sector bets are in favour, like in 2022, when Energy was the top performing sector, the DHS ETF ‘boomed’, returning 7.9% in total returns in 2022, beating the S&P 500’s -18.1% by a country mile. (Figure 3).
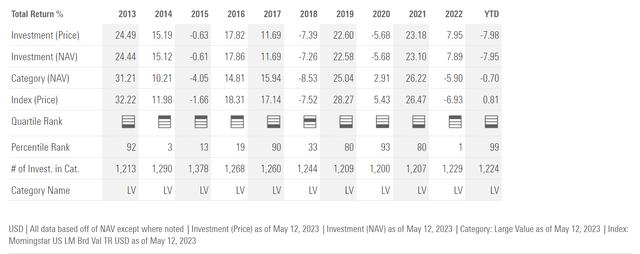
Figure 3 – DHS annual returns (morningstar.com)
The problem with this approach is that no sector stays in favour forever. Currently, the DHS ETF’s sector allocation is still heavily weighted towards Energy (19.6%), Financials (17.0%) and Utilities (14.3%) (Figure 4).
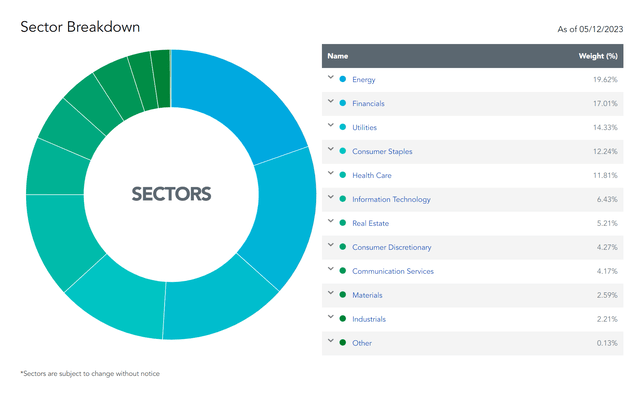
Figure 4 – DHS sector weights as of May 2023 (wisdomtree.com)
However, YTD, Energy and Financials have been the biggest sector laggards, returning -10.2% and -6.7% respectively as measured using the Energy Select Sector SPDR ETF (XLE) and the Financials Select Sector SPDR ETF (XLF) (Figure 5). Therefore, DHS’s performance has been more of a ‘bust’, returning -8.0% YTD to May 12, 2023 compared to the S&P 500’s +8.0%.
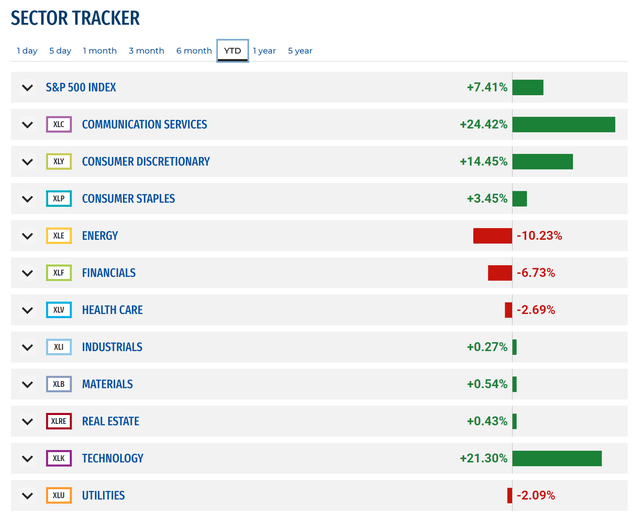
Figure 5 – Sector returns YTD (sectorspdrs.com)
Near Term Outlook Unfavourable
Looking forward, given DHS’s heavy exposures to energy and financial companies, my outlook for the DHS ETF is unfavourable. This is because as the U.S. economy faces an impending recession, cyclical sectors such as energy and financials tend to underperform the market (Figure 6).
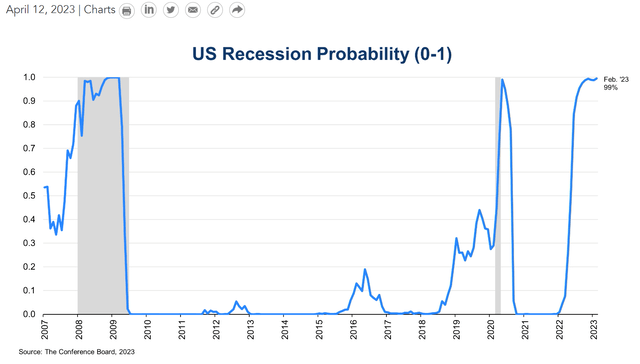
Figure 6 – High probability of impending recession (Conference Board)
Energy companies are price takers; when an economy enters a recession, there is less demand for energy commodities, which causes energy commodity prices to plummet (Figure 7). This significantly impacts energy companies’ revenues and earnings.

Figure 7 – Energy commodities like crude oil typically plummets during recessions (St. Louis Fed)
For financial companies, the problem lies with their business model, which relies mostly on lending money to companies and individuals and earning an interest spread. During recessions, companies and individuals experience financial stress and default on their financial obligations (this is modeled by elevated high yield credit spreads in Figure 8 below). This creates elevated levels of credit losses for financial companies.

Figure 8 – Credit spreads spike during recessions, indicating financial stress (St. Louis Fed)
Therefore, the DHS ETF, with heavy exposure to energy and financial companies, is expected to underperform the markets in the coming months as the U.S. enters a recession.
Updated Peer Comparison
Figure 9 shows an updated peer comparison chart, with the addition of more funds under coverage.
Overall, as we have shown above, DHS’s near term returns have turned from peer leading to peer lagging, with long term returns still middle of the pack.
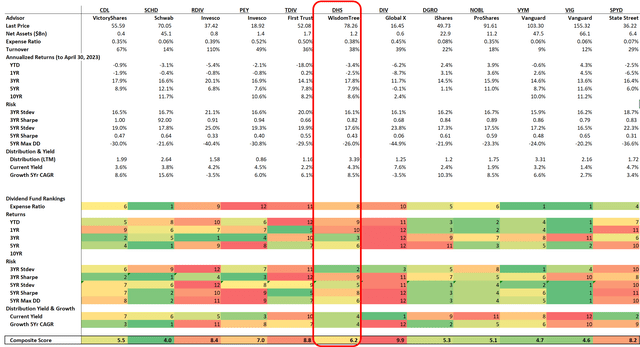
Figure 9 – Dividend ETF peers comparison (Author created with data from Seeking Alpha and Morningstar)
DHS’s risk metrics are also uninspiring with volatilities and Sharp Ratios near the middle of the pack compared to peers.
Our assessment of the DHS ETF remains the same; the DHS fund is a ‘boom/bust’ fund that outperforms when the stars (i.e. sectors) are aligned but underperforms when they are not.
Conclusion
In my prior article, I warned that the DHS ETF’s extreme sector bets can lead to ‘boom/bust’ returns. Unfortunately, we are currently experiencing the bust phase, as its heavy bets on energy and financial companies are not well suited to the current macro environment where the U.S. economy is headed towards a recession.
For long-term investors who do not wish to try to time the market, I recommend they stay away from the DHS ETF and consider alternatives like the Schwab U.S. Dividend Equity ETF (SCHD) or the Vanguard Dividend Appreciation ETF (VIG), which have more consistent returns and more balanced sector allocations.
Read the full article here


