
Editor’s note: Seeking Alpha is proud to welcome Jevic Kandolo as a new contributor. It’s easy to become a Seeking Alpha contributor and earn money for your best investment ideas. Active contributors also get free access to SA Premium. Click here to find out more »
The recreational vehicle industry, in which THOR Industries (NYSE:THO) operates, has a history of cyclical consumer demand driven by economic and demographic conditions.
For the fiscal year ending 2023, THOR Industries has experienced challenging conditions. The company had anticipated a dip in revenue for the year’s second quarter, in line with the seasonal drop in RV sales during winter months. However, this year, the company has been hit by a downturn that surpasses typical seasonal patterns. This downtrend has lasted throughout the year, marking a sharp 25% year-on-year drop so far.
While THOR remains a company of considerable value, this unexpected dip this year adds a layer of uncertainty to its future performance. Despite the company’s inherent value, the current circumstances have led to a potentially inflated valuation, making it less attractive for immediate investment. Therefore, a ‘hold’ recommendation for THO stock is the prudent course of action at present.
Promising Yet Unexciting in FY23
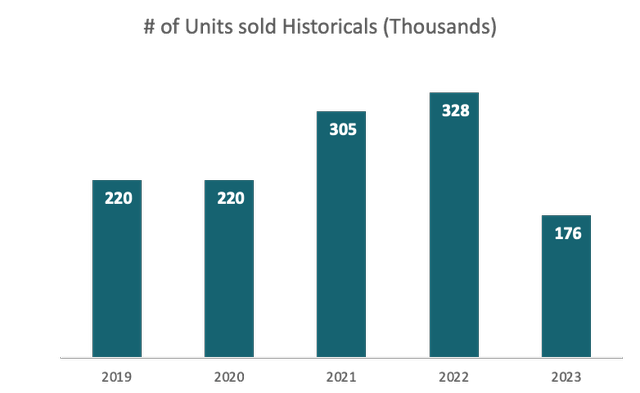
In FY23, Thor Industries faced considerable operational challenges. Unit sales sharply declined from approximately 328,000 in FY22 to around 176,000 in FY23, marking a nearly 50% decrease. Yet, surprisingly, revenue only fell by 25%. This discrepancy suggests the company’s strategic maneuver to sell fewer units at considerably higher prices, successfully cushioning the blow on revenues. This trend continued throughout the year, with unit sales failing to regain lost momentum but revenue remaining comparatively steady, largely due to the successful implementation of this high-pricing strategy. Thor’s resilience in managing these headwinds underscores its ability to adapt to market conditions and extract maximum value.
Furthermore, the growth in the European market represents a significant untapped potential for Thor. As global travel restrictions loosen up post-COVID, the RV market could see a significant boost, especially in regions like Europe, where the culture of road trips and outdoor vacations is on the rise. The successful navigation in this market suggests that Thor is well-positioned to take advantage of this trend, potentially leading to significant growth in unit sales and revenue.
While Thor Industries showcased remarkable resilience and strategic adaptability in FY23, there’s reason to temper expectations for the near future. The RV boom driven by pandemic-era demand was exceptional, and its contribution to Thor’s recent growth trajectory can’t be overstated.
As a result, projecting this extraordinary demand forward isn’t realistic. The current compound annual growth rate, factoring in the post-COVID landscape, doesn’t paint a bullish picture for Thor’s valuation over the next 3 to 5 years. Therefore, while Thor’s strategic moves and potential in the European market are impressive, they might not suffice to sustain an aggressive growth narrative in the medium term.
Financial Assessment
Ratio analysis—Income statement workbook (detailed spreadsheet available here)
SEC Filings & own calculation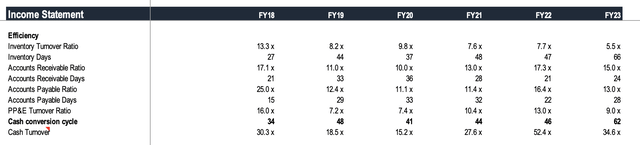
From an efficiency standpoint, THOR went through an overall trend of somewhat reduced inventory efficiency, even though the company still performed slightly better than the majority of its peers. Its Cash Conversion Cycle increased from 34 to 62 days in 2023 (almost doubled), implying a longer time is needed to convert inventory and other resources into cash. Though it deteriorated, it is still doing better than its close competitor Winnebago: 64, or even Polaris:65, and Camping World Holdings: 148 (retrieved on GuruFocus). The cash conversion cycle increase is not very alarming as of now; however, it suggests that THOR has a harder time selling off its inventory year after year.
From a liquidity perspective, THOR’s current ratio fluctuates between 1.4 and 1.8x. This is a healthy level, indicating that the company has more than enough resources to cover its short-term liabilities.
SEC Filings & own calculation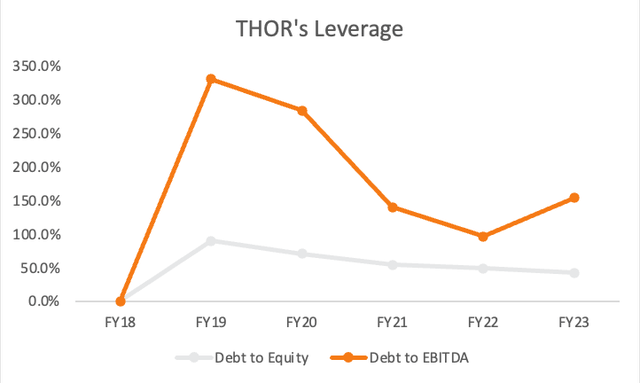
From a leverage and solvency point of view, the Debt to Equity ratio has been consistently decreasing from 90% to 42.1%. This means the company is using less debt to finance its growth, reducing its risk profile. Moreover, Debt to EBITDA, Despite fluctuations, has seen a reducing trend. This implies the company is becoming increasingly capable of paying back its debts with its earnings.
SEC Filings & own calculation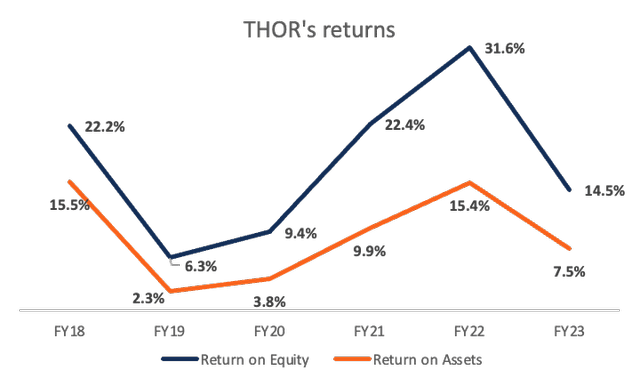
From a Return perspective, THOR has not been able to deliver absolute returns over the last five years, even though it was subject to some volatility. The total Asset Turnover Ratio shows that the company’s efficiency in using all its assets to generate revenue has been somewhat volatile and declining from the high in 2018. This may be the case because of its aggressive acquisition strategy thus far, which management ought to temper in consequent years. Regarding Return on Equity, it fluctuated over the next few years, reaching its peak at 31.6% in 2022 before dropping to 14.5% in 2023. In comparison to the industry, both ratios beat around 80% of the companies in the Vehicles & Parts industry (Gurufocus).
SEC Filings & own calculation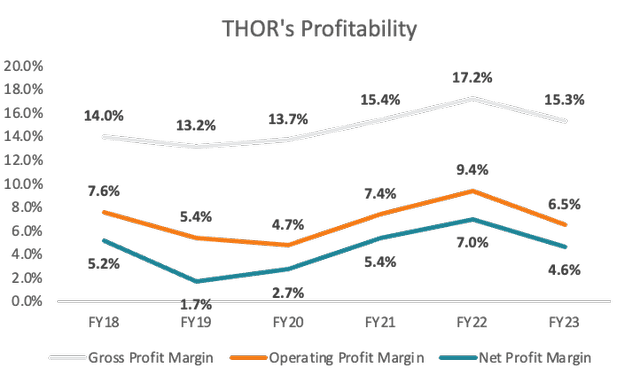
When it comes to profitability, we can see that THOR operates on razor-thin edge margins; however, it has never lost money since its inception. Their margins fluctuated a bit since 2018 but stayed within the same range.
The bottom line is THOR is a financially healthy company because it has been profitable, not overly leveraged, can cover its short-term and long-term obligations with its earnings, and because they have provided absolute returns to its shareholders.
Valuation
To come up with a fair value of THOR industry share price, I used a Comparable Company Analysis to see how the company measures up to its peers and Discounted Cash Flow Analysis to find an intrinsic value range. So let’s start with the comparable company analysis.
Seeking Alpha & own calculation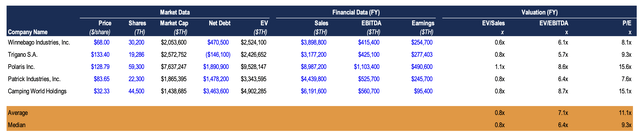
For this analysis, I identified companies that operate in similar markets or share operational characteristics with THOR. These included Winnebago Industries (WGO), Trigano S.A.(OTC:TGNOF), Polaris Inc. (PII), Patrick Industries (PATK), and Camping World Holdings (CWH).
Next, I determined three important metrics for comparison: EV/Sales, EV/EBITDA, and the P/E ratio. Applying the median values of these ratios from the selected comparable firms to THOR’s financials, I derived an estimated enterprise value for THOR, providing a rough gauge of its market value. The results, based on median values, suggested the following implied share prices: $163.62 (using EV/Sales), $116.59 (using EV/EBITDA), and $87.73 (using the P/E ratio). Based on this analysis, we can infer that the market values THOR Industries anywhere between 87.73$ to 163$ per share. (Detailed spreadsheet of comp tables available here.)
The Comp Analysis method, though useful, has some limitations. It doesn’t consider a company’s actual worth (intrinsic value), focusing instead on current market values. As a result, it often emphasizes short-term aspects, possibly missing long-term plans or downside risks. These shortcomings make it beneficial to pair this method with the Discounted Cash Flow analysis.
SEC Filings & own calculation
In this discounted cash flow analysis, we forecast five-year cash flows, accounting for 5 key variables:
(1) Unit Sales Volume: This is a direct indicator of market demand and sales effectiveness, thereby heavily impacting revenue.
(2) Average Selling Price per Unit: It mirrors the company’s pricing strategy and market perception of its products, also significantly influencing revenue.
Other factors considered include (3) COGS and OpEx per unit, (4) CapEx per unit, and (5) depreciation & amortization per unit, giving us insight into costs, capital expenditure, and asset utilization. For accuracy, I used conservative growth rates across these variables.
In the base case scenario, I project a modest 2.5% annual growth rate in unit sales, taking into account the unpredictable nature of unit sales in recent years. My assumption is rooted in the expectation that the company will rebound from its current performance and consistently enhance its unit sales year on year through 2028. The average selling price per unit witnessed a notable surge of 39.4% this year, which made selecting a suitable growth rate quite challenging. My aim was to avoid any distortion in the results; hence a less aggressive rate seemed a more reasonable choice. As such, I settled on a 1.5% increase in price for both the base case and blue sky scenarios over the forecast period. This 1.5% increment is also reflected in the projections for COGS and OpEx per unit, aligning with their past trends that seemed to parallel the price increases. In terms of CapEx per unit, I assumed a consistent growth rate of 1.5%, which suggests a sustained level of expenditure over the coming five years. For depreciation and amortization per unit, the pattern over the last five years has been irregular. As the company’s past investments could now be in peak depreciation years, this might lead to depreciation costs outpacing current CapEx. This is the rationale behind selecting a slightly higher growth rate of 2.5% for depreciation and amortization.
In the most optimistic, or ‘blue sky,’ scenario, I maintain all existing assumptions except for one significant change: I anticipate a 10% year-over-year increase in the number of units sold.
SEC Filings SEC Filings & own calculation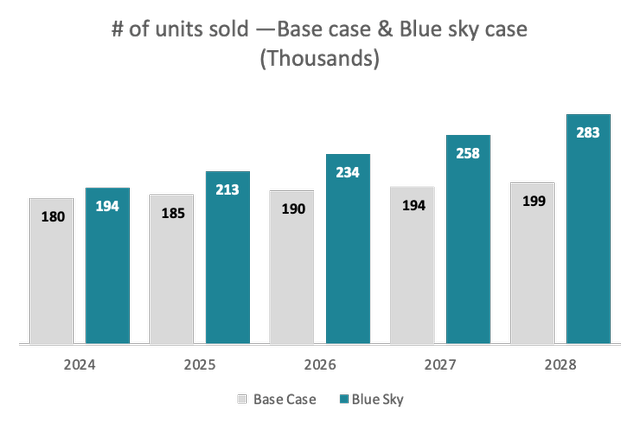
We then calculate the free cash flow for the firm (FCFF) before discounting these future cash flows at a rate of 12.50%, the company’s cost of Equity, given its current capital structure. Beyond our projection period, I assumed cash flows would grow at a stable 3.74% rate (US T-BILLs long-term average), yielding the terminal value.
Adding together the present values of the projected cash flows and terminal value gives us the enterprise value. For the base case, I obtained a fair value range of $80.11—$90.92, which is about $29.70—$18.89 overvalued compared to the July 22nd closing price of $109.81:
(To establish the range, I factored in a 5% increase in units sold, which yielded a fair value of $90.92).
SEC Filings & own calculation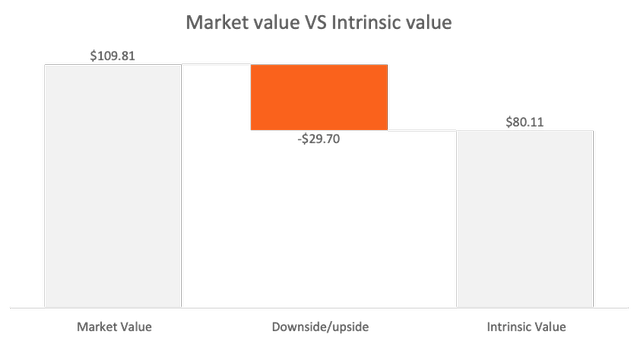
In the blue-sky scenario, which assumes more favorable future conditions, such as accelerated growth in the number of units sold, the fair value range is estimated to be between $90.92 and $115.48. This implies that at the lower end of this range, the company’s shares are still overpriced by $18.89, while at the upper end ($115.48), the company’s shares would be undervalued by $5.67 compared to the July 22nd closing price. This indicates a skewness towards an overvaluation. (Detailed spreadsheet of DCF available here.)
SEC Filings & own calculation
Valuation Summary
SEC-Filings and own computations
This chart presents the historical data and projected values for the Free Cash Flow to the Firm (FCFF) in my base-case scenario. The projections are heavily influenced by the present performance of the free cash flows, which are displayed as increasing year over year.
The downside risk of this assumption is that the current performance of free cash flows may not necessarily continue in the same pattern in the future.
SEC Filings & own calculation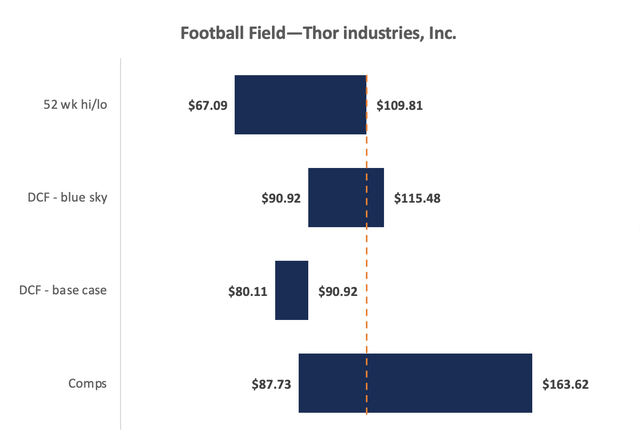
Investment Risks
- Cyclical Nature of the RV Industry: Similar to other consumer discretionary sectors, the RV industry is heavily cyclical and highly sensitive to macroeconomic factors such as changes in consumer confidence and disposable income. In periods of economic decline or uncertainty, consumers may delay or forego RV purchases, leading to a decrease in sales volume for THOR Industries. This was seen in the financial crisis of 2008 and could potentially recur during other periods of economic downturn.
- Competitive Market Environment: The RV industry is highly competitive, with numerous established manufacturers and new entrants. THOR Industries faces intense competition from both domestic and international companies that may have larger resources or could innovate faster. This competitive landscape could impact THOR’s market share and profitability.
Takeaway
While Thor Industries showcased resilience and adaptability in FY23, the RV boom during the pandemic may not extend into the future. Despite the company’s strategic initiatives and potential in the European market, they might not be sufficient to support an aggressive growth narrative over the next 3-5 years. Thus, a ‘hold’ stance on THO stock seems the most prudent course of action at present.
Read the full article here

