
Office REITs remain beaten down, due to the WFH (work-from-home) trend, which is here to stay. Of the 18 REIT sectors, only Cell Towers and Cannabis REITs have fared worse than the (-8.74)% total return posted by Office REITs YTD (year-to-date), while the average equity REIT has returned 3.87%. Meanwhile, the NASDAQ and the S&P indexes have raced ahead at double digits, and even the Dow has returned 6.72% thus far.
Hoya Capital
There are a few bright spots in the Office REIT sector, however. Sunbelt and secondary market office leasing rates have recovered to 75% of pre-pandemic levels. As office properties continue to be repurposed or abandoned, the supply/demand imbalance will continue to improve overall. While urban markets with long commute times will continue to suffer, Hoya Capital believes that Sunbelt and secondary-focused REITs have bottomed.
This article examines growth, balance sheet, dividend, and valuation metrics for one such company.
Meet the company
Cousins Properties
Founded in 1958 and headquartered in Atlanta, Cousins Properties (NYSE:CUZ) went public in 1962, and converted to a REIT in 1987. The company owns just under 19 msf (million square feet) of amenity-rich office space in 8 secondary markets, all in the Sunbelt, with the strongest concentrations in Atlanta and Austin, which account for two-thirds of the company’s NOI (net operating income).
The buildings average just 19 years of age, and nearly half (41%) have been delivered or redeveloped since 2015. Every asset in the portfolio is rated Class A, and CUZ enjoys a 90.8% occupancy rate as of June 2023.
Company investor presentation
The glut of office space has caused a flight to quality, and CUZ is a prime beneficiary, with asking rents 9% above pre-pandemic levels, and 23% above the Class A average in its markets.
Company investor presentation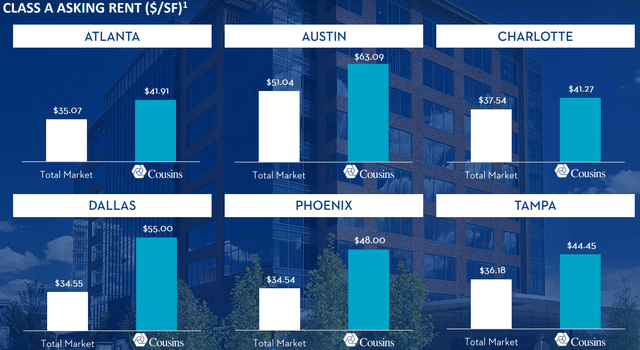
CUZ has 1.3 msf of new development in the pipeline, and a land bank that can support an additional 5.1 msf.
Growth metrics
Here are the 3-year growth figures for FFO (funds from operations), and TCFO (total cash from operations).
| Metric | 2019 | 2020 | 2021 | 2022 | 3-year CAGR |
| FFO (millions) | $329 | $413 | $409 | $409 | — |
| FFO Growth % | — | 25.5 | (-1.0) | 0.0 | 7.5% |
| FFO per share | $2.53 | $2.78 | $2.75 | $2.72 | — |
| FFO per share growth % | — | 9.9 | (-1.1) | (-1.1) | 2.4% |
| TCFO (millions) | $303 | $351 | $389 | $365 | — |
| TCFO Growth % | — | 15.8 | 10.8 | (-6.2) | 6.4% |
Source: TD Ameritrade, Hoya Capital Income Builder, and author calculations
CUZ grew its FFO and cash flow throughout the pandemic, but took a small step back over the last 12 to 18 months. The healthy 3-year growth rates seen above are almost all due to the company’s performance in 2020. FFO per share growth for CUZ is markedly slower than its FFO growth overall, indicating that share issuance has played an outsized role in the company’s expansion.
Meanwhile, here is how the stock price has done over the past 3 twelve-month periods, compared to the REIT average as represented by the Vanguard Real Estate ETF (VNQ).
| Metric | 2020 | 2021 | 2022 | 2023 | 3-yr CAGR |
| CUZ share price, July 19 | $29.61 | $38.07 | $29.97 | $24.52 | — |
| CUZ share price Gain % | — | 28.6 | (-21.3) | (-18.2) | (-6.09)% |
| VNQ share price, July 19 | $78.67 | $103.39 | $93.50 | $86.06 | — |
| VNQ share price Gain % | — | 31.4 | (-9.5) | (-8.0) | 3.04% |
Source: MarketWatch.com and author calculations
CUZ shares have lagged the VNQ in each of the past three twelve-month periods, resulting in a 3-year CAGR of (-6.1)%, compared to a gain of 3.04% for the VNQ. Like all office REITs bought in 2020, it has been a disappointing investment.
Meanwhile, Cousins is optimally sized at a market cap of $3.72 billion.
Balance sheet metrics
Here are the key balance sheet metrics. Cousins’ liquidity is superb, and its Debt/EBITDA of 5.1 is also stellar.
| Company | Liquidity Ratio | Debt Ratio | Debt/EBITDA | Bond Rating |
| CUZ | 2.59 | 38% | 5.1 | — |
Source: Hoya Capital Income Builder, TD Ameritrade, and author calculations
Less than 3% of Cousins’ debt matures in the next two years. Just over three-quarters of the debt (78.3%) is unsecured.
Company 10-Q for Q1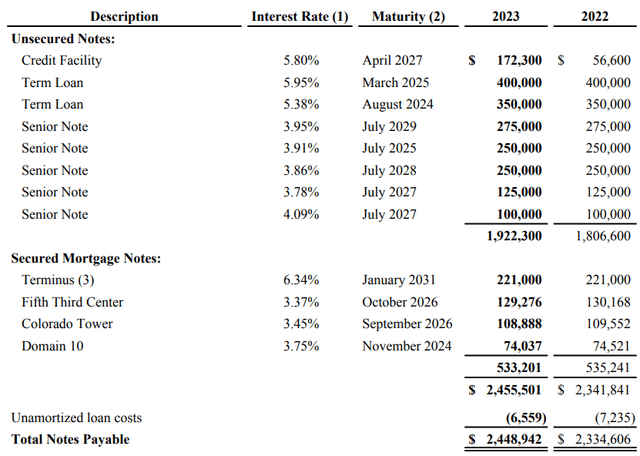
The weighted average maturity is 3.8 years, but the weighted average interest rate is high, at 4.75%. Of the total debt, 8.4% is held at variable rates.
Dividend metrics
Unlike the vast majority of Office REITs, CUZ never cut its dividend during the pandemic or since. Its current Yield of 5.39% is considerably fatter than the average REIT, and even with slow dividend growth of 2.2%, its Dividend Score of 5.75 is very near the REIT average. The payout is too safe, if anything, rated by Seeking Alpha Premium at A-.
| Company | Div. Yield | 3-yr Div. Growth | Div. Score | Payout | Div. Safety |
| CUZ | 5.39% | 2.2% | 5.75 | 50% | A- |
Source: Hoya Capital Income Builder, TD Ameritrade, Seeking Alpha Premium
Dividend Score projects the Yield three years from now, on shares bought today, assuming the Dividend Growth rate remains unchanged.
Valuation metrics
CUZ sells at an FFO multiple (9.2) that is barely more than half that of the average REIT, and at a 15% discount to its NAV, according to Hoya Capital Income Builder.
| Company | Div. Score | Price/FFO ’23 | Premium to NAV |
| CUZ | 5.75 | 9.2 | (-15.2)% |
Source: Hoya Capital Income Builder, TD Ameritrade, and author calculations
From a value investor’s perspective, these are good numbers. From a growth investor’s point of view, these are warning signs.
What could go wrong?
Because CUZ operates in fewer than 10 markets, local changes in supply, demand, laws, or demographics can make a big difference. This is particularly true in Atlanta and Austin, which together comprise more than 67% of the company’s assets. In its 10-K, the company lists political instability, social unrest, and climate change as risk factors. All three are only getting worse. The WFH trend is a headwind that won’t go away any time soon, and the supply/demand imbalance in office properties may linger for quite some time. The company also owns 2.2 msf of rentable space in buildings that sit on land they don’t own, so they are obligated to pay ground leases.
Investor’s bottom line
Cousins is definitely not a growth investor’s play. However, from a value investor’s point of view, it is attractive. The dividend is higher and safer than average, and it is trading at a favorable FFO multiple and a solid discount to NAV. Add in recent positive earnings revisions, and this could be a good time to nibble. I rate this company a cautious Buy, with a small allocation. Be prepared for volatility. That is just part of the ride for this company.
The Street, Zacks, and Ford Equity Research rate CUZ a Hold, while TipRanks thinks the company will outperform. Hoya Capital views it as nearly 20% undervalued.
The Seeking Alpha Quant ratings system tags CUZ as a Strong Buy.
Seeking Alpha Premium
Six of the 11 Wall Street analysts covering CUZ rate it a Buy or Strong Buy, with an average price target of $25.67, implying 8.1% upside.
As always, however, the opinion that matters most is yours.
Read the full article here

