
While the market constantly debates whether the Fed needs to hike interest rates again, the debate shouldn’t really exist anymore. The CPI and PPI data this week were weak compared to expectations, and the market knows housing data mis-states CPI core inflation, yet the market still accepts the Fed hiking rates again in July. Regardless, the S&P 500 (SP500) has already soared back near all-time highs, making small-cap stocks more appealing here.
Source: Finviz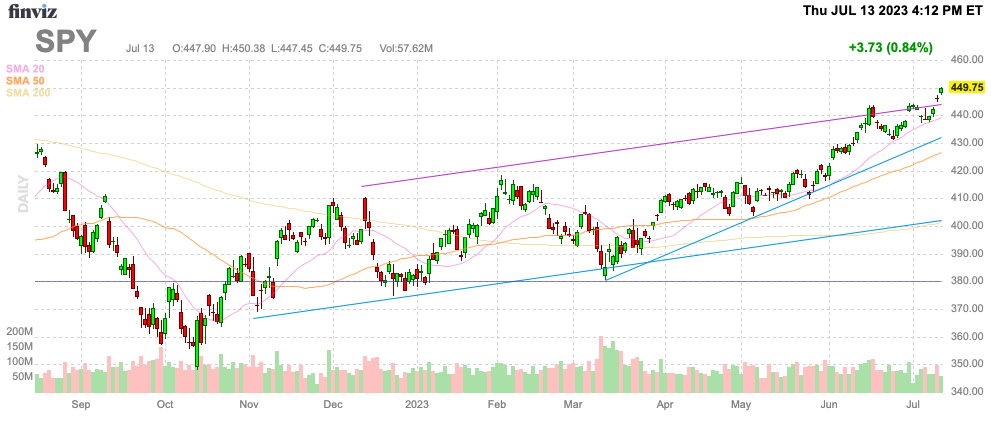
Old Inflation Data Falling
First, CPI remains at reported elevated levels due primarily to housing data that accounts for 30% of the index. The index printed the smallest one-month increase in inflation data since August 2021.
- CPI rose 0.2% in June, less than the 0.3% increase expected, but more than the 0.1% increase in May.
- CPI YoY rose 3.0% vs. +3.1% expected and 4.0% prior.
- Core CPI, which excludes food and energy, increased 0.2% in June, less than the 0.3% increase expected and the 0.4% rise in May.
- Core CPI YoY rose 4.8% vs. 5.0% expected and 5.3% prior.
Both the headline and core CPI data continue to collapse. Consumer prices are falling from elevated levels, but the prices aren’t falling fast enough for the Fed.
Source: WSJ 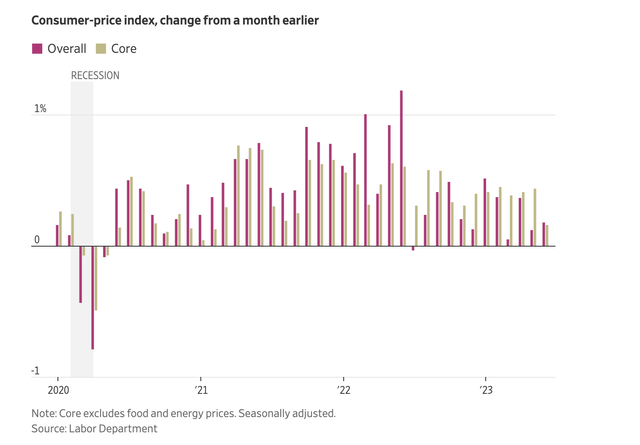
Housing continues to be the major headwind, yet investors know housing isn’t an issue for inflation any more outside of the equivalents rent number utilized by the Fed. The shelter portion of the report was up 0.4% in June from May and accounted for 70% of the hike in core CPI inflation.
Second, the encouraging Producer Price Index data from today is more promising in providing the Fed with a reason to continue pausing rate hikes. The June data was as follows:
- PPI crept up 0.1%, less than the 0.2% increase expected and compared with a 0.3% decline in May.
- PPI YoY basis rose only 0.1%, less than the 0.5% rise expected, and cooler than the 1.1% increase in May.
- Core PPI, which excludes food and energy, also edged up 0.1% vs. 0.2% expected and 0.2% in May.
- Core PPI YoY rose 2.4% vs. 2.8% expected and 2.8% prior.
The core PPI favored by the Fed is already generally within the 2% target range of the Fed. Core PPI only rose at a 1.2% annualized rate in June and is only up 2.4% over the last year, with clear signs inflation threats for producers are over and will feed into CPI.
Source: Twitter – Carl Quintanilla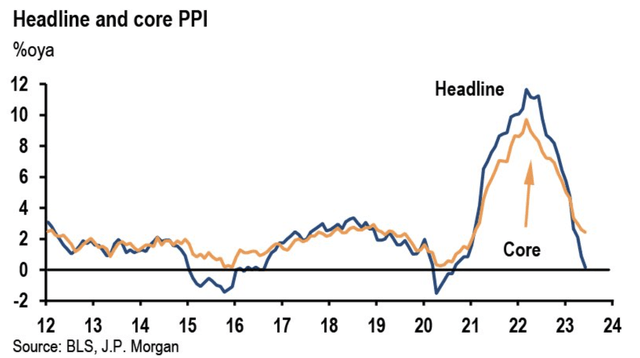
Any economist or investor should look at the above chart with knowledge of the lagging impact of prior Fed rate hikes of 500 basis points and realize inflation is under control.
Modern Inflation Data
While both the CPI and PPI reports show positive trends for inflation rates decelerating, the Truflation data already has “real” CPI inflation at only 2.47%. The inflation report uses modern consumer and spending data sets to deliver verifiable daily inflation indexes using over 10 million data points.
Source: Truflation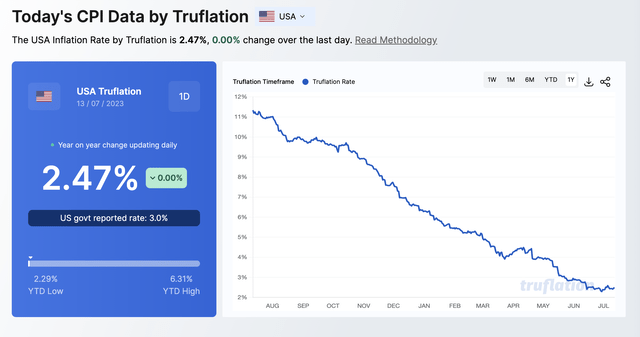
The crucial housing data is already trending down per Truflation. The modern inflation index has housing inflation down 0.7% versus mid-June, with a combination of owned dwellings and rented dwellings prices down 2.5% in the last quarter alone.
Source: Truflation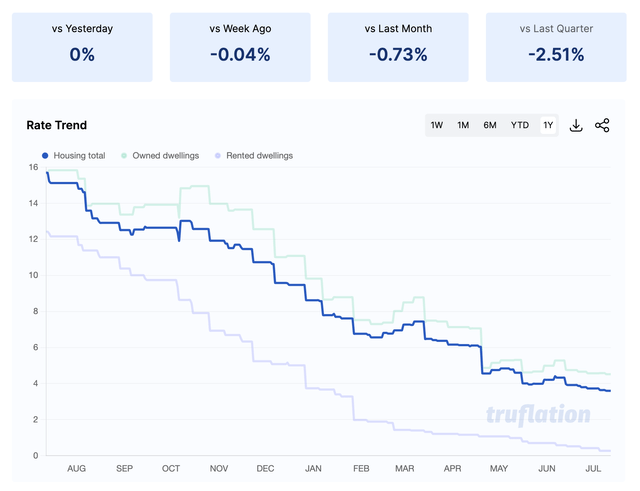
Historically, the market always thought the Fed had more data than the market, but investors should now realize these experts are mostly relying on outdated metrics like equivalents rent. The government officials are using data leading to inflation data lagging the real-time market numbers.
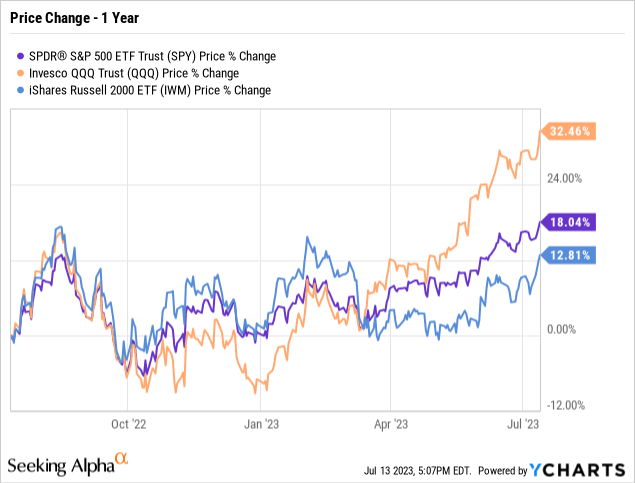
The signs inflation problems are coming to an end and rate hikes are over has the Russell 2000 (NYSEARCA:IWM) stocks rallying. The small-cap stocks have underperformed big returns in the S&P 500 and the Nasdaq 100 (QQQ) over the last year, providing a preference for the small-cap stocks into year-end.
Takeaway
The key investor takeaway in that the data using modern inflation data (and even PPI) show inflation is down to a point where the Fed wouldn’t normally need to hike interest rates anymore. The Fed has already hiked rates 500 basis points, and the 6 to 12 month lag on rate hikes still haven’t fully impacted economic data.
After a big rally in the major indexes of large cap stocks focused on the Magnificent Seven stocks, investors should have a preference for small-cap stocks in the Russell 2000.
If you’d like to learn more about how to best position yourself in under valued stocks mispriced by the market heading into a 2023 Fed pause, consider joining Out Fox The Street.
The service offers model portfolios, daily updates, trade alerts and real-time chat. Sign up now for a risk-free, 2-week trial to start finding the next stock with the potential to generate excessive returns in the next few years without taking on the out sized risk of high flying stocks.
Read the full article here

