
The Energy sector has been on a volatile ride, especially during recent years following black-swan events such as COVID and the European energy crisis. The Invesco S&P SmallCap Energy ETF (NASDAQ:PSCE) offers investors an unique exposure into the small-cap energy space. The fund aims to track the S&P SmallCap 600® Capped Energy Index, consisting of all energy constituents within the small cap universe.
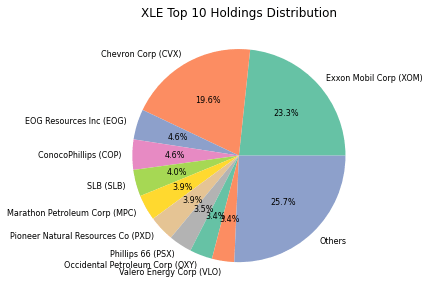
Given the niche focus, it may not be surprising that PSCE is concentrated with top 10 holdings taking up 60% of the fund NAV. The top 3 holdings (CIVI, SM, HP) represent more than a quarter of the fund NAV too. However, it is worth noting that XLE (The Energy Select Sector SPDR® Fund, its large cap peer index) is much more concentrated with top 10 holdings representing 75% of fund NAV.
Author, Yahoo Finance Author, Yahoo Finance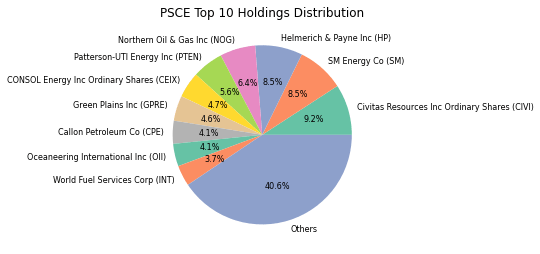
Performance & Risk Review
Year-to-date, PSCE has performed poorly against the broad market (SPY) but tracked closely to the performance of XOP and XLE which provides broad exposures to the Oil & Gas industry and Energy sector respectively. From the chart, we also observe the dispersion in YTD returns between Russell 2000 (a more frequently-used standard for Small Cap) value vs growth, where growth outperformed value significantly. This also explains the returns of SPY which has mostly been driven by several large tech names. Hence, the return driver has not been about small vs large cap, but rather growth vs value which PSCE has been negatively impacted with pure energy sector exposures.
Author, Yahoo Finance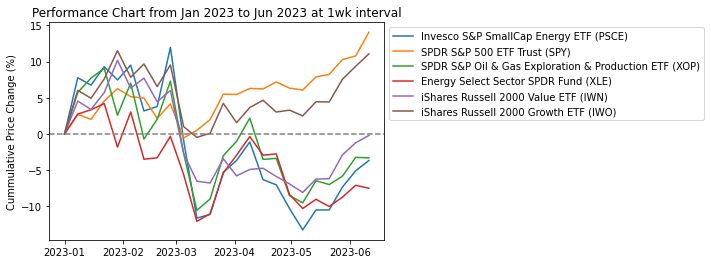
However, the story could have also been told differently. Performance across the same indices are almost completely opposite since January 2022, primarily driven by the European energy crisis which led to record-high oil prices. All energy indices (PSCE, XOP, XLE) are up by 20-30%, while other broad market indices remained in the negative territory.
Author, Yahoo Finance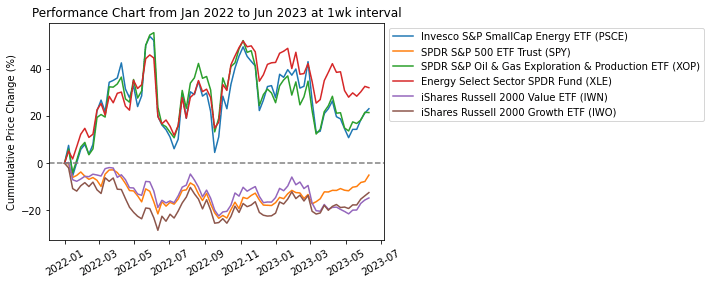
With energy stocks being highly correlated with long volatility, PSCE has become much less volatile in recent months, where the standard deviation (gray part in the chart below) narrows and the fund is currently trading around its rolling 3-month mean. This is, however, also the overall reflection to the equity market where VIX is at its 3Y low.
Author, Yahoo Finance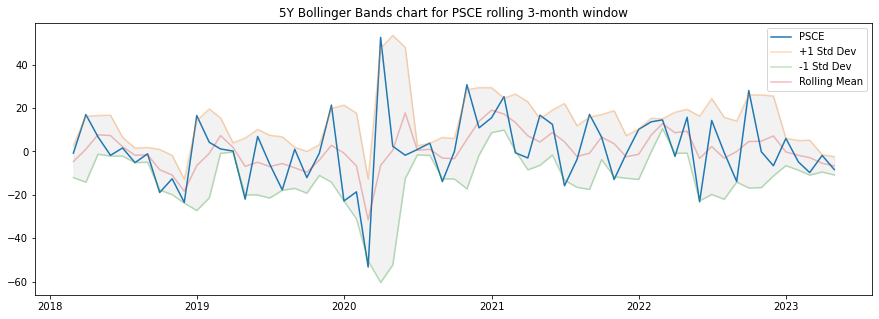
Deep Dives
Today, the S&P 500 is trading at around 22x P/E, while PSCE only at 5.5x. Compared to its peers in the Energy sector, XOP trades lower at 4x P/E while XLE trades at 7.2x. Thus, from the trading multiple standpoint, small cap energy stocks are not particularly cheaper or more expensive – but largely follows that of large cap energy stocks.
Diving into the trading multiples across top holdings within PSCE, most do have reasonable valuation (except for GPRE which looks unprofitable, and it’s actually a biofuel producer) with P/E ranging from 2x to 35.5x and P/B ranging from 0.6x to 3.4x. OII with high P/E multiple is also not a typical energy stock, but a technology company providing engineering solutions to offshore energy producers. Thus, the fundamentals of PSCE are much more diversified than XLE which mostly are large oil & gas producers.
Author, Yahoo Finance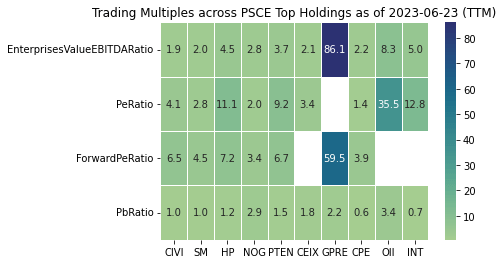
The variation in business models across the top holdings also reflect the differences in profitability metrics, where oil producers such as NOG had sky-high EBITDA margins, return on assets and return on equity benefiting from high energy prices last winter. Other stocks with lower return on equity do not have direct exposure to the short-term oil & gas gains, such as HP which provides drilling solutions and INT which provides logistics solutions to energy producers.
Author, Yahoo Finance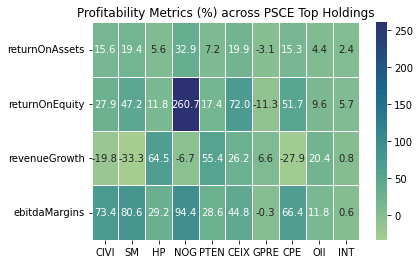
With rising interest rates and therefore borrowing costs, liquidity ratio is important to look at, especially among the small cap stocks which may often be more associated with higher debts and worse liquidity than larger cap peers. Across the top 10 holdings, the debt to equity ratio looks modest overall, only with NOG and OII having 1.7x debt than its equity. Quick ratio (where more than 1 is good, indicating that current assets deducted by inventory is more than current liabilities) may be more concerning for several names, in particular CPE at just 0.3 and NOG at 0.8 given its potentially large debt burden. While the purpose of this analysis is not to dive into any specific company, investors should be cautious when approaching these companies with weak liquidity to avoid potential drawdowns.
Author, Yahoo Finance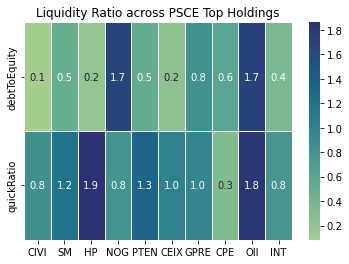
Conclusion
With that, there are 3 key takeaways for any investor or potential investor for PSCE.
Firstly, one should understand the distinction between PSCE and its large cap peer index ETFs such as XLE or XOP. As we have analyzed, it is not just about differences in size but most importantly the differences in business and operating models as many constituents of PSCE are solutions/ service providers to the Oil & Gas producers or even alternative energy producers. Hence, they will have distinct financials from the energy producers, which may cause deviations in valuation.
Secondly, despite the first point, PSCE’s return has mostly tracked its large cap peer index throughout the European energy crisis with high oil prices. This may not be fully supported by fundamentals but they are highly correlated. Thirdly, valuations for key constituents within PSCE look fair relative to the energy sector, but there may be liquidity concerns for several names given the persistently high interest rate environment.
Read the full article here

