
Every two weeks we plan to summarize what investors expect over the intermediate to long term by compiling investment surveys and by measuring investor activity.
Investor Surveys
We monitor five investment surveys and graph them on the Sentiment King ranking scale. The scale goes from “very bullish” to “very bearish” and you’ll find a full explanation in this previous article. But it’s somewhat intuitive if you study the table below and read the summary of each survey.
The surveys point to a continuation of the rally and higher stock prices.
Table of Major Investment Surveys (Sentiment King)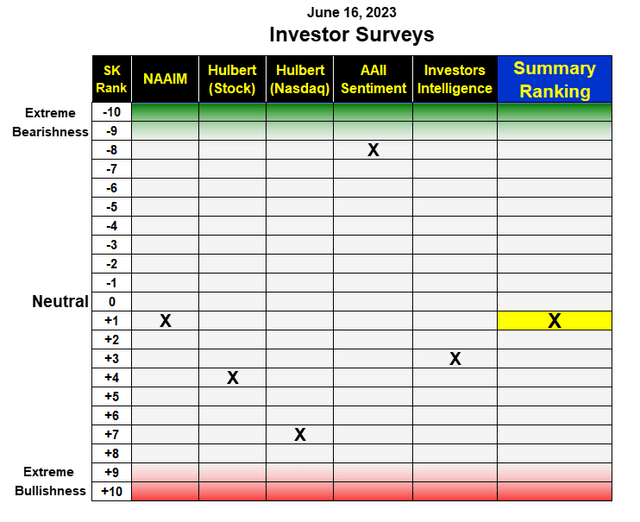
The AAII Member Sentiment Survey – Last week’s survey of the American Association of investors had 45.2% of members bullish, 32% neutral and 22.7% bearish. While the percent is rapidly moving toward more bulls, our intermediate term rankings of this survey is –7, which is still rather bearish.
Investors Intelligence Newsletter Survey – Last week the granddaddy sentiment indicator found 53.4% of newsletter writers bullish, 20.6% bearish and 26% expecting a correction. This again is the highest bullish percent in over a year. The Sentiment King Ranking of this survey is +3, which is the bullish side of neutral.
NAAIM Exposure Index – The exposure index represents the average investment position of the American Association of Active Investment Managers. The current reading is 80.6, which means they are on average 80% invested. Our ranking puts this index at +1, which is just past neutral.
Hulbert Stock Survey – Our ranking of the Hulbert stock market survey is +4, which puts it halfway between neutral and extremely bullish.
Hulbert Nasdaq Survey – Our ranking of the Hulbert Nasdaq survey is +7, which puts it just two units shy of extreme bullishness. This is to be expected because of the strong rally in Nasdaq stocks.
The summary ranking of all five surveys is +1. This is slightly on the bullish side of neutral and is far from being “too bullish.” This low ranking after a seven month rally is a positive sign for even higher stock prices.
Investor Activity
We also analyze what investors are buying and selling to determine what they expect the stock market to do. We monitor six metrics; five are calculated daily.
Investor Activity Table (Sentiment King)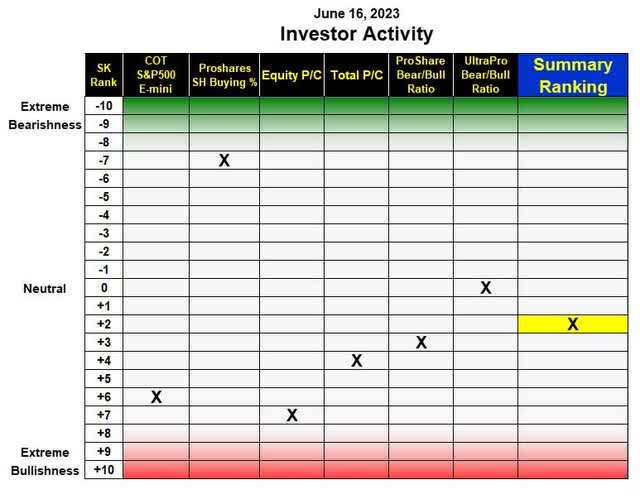
Total Puts and Calls Ratio – Higher prices is encouraging more call buying and less put purchases, which lowers the puts to calls ratio. Our moving average of the ratio of all CBOE options is now .88. This puts it at +4 on the SK ranking scale, which is halfway between neutral and very bullish.
Equity Puts to Calls Ratio – The same is true of the ratio of equity “puts to calls.” The current ratio is .56, which puts it +7 on the SK ranking scale. It’s rapidly approaching ratios that are associated with extreme bullishness in the past. History shows this is the best option indicator of market direction.
S&P 500 E-mini COT – Short positions of asset managers of E-mini S&P futures fell again last week to 23.3%. This puts it as +6 on the ranking scale and only two notches away from the very bullish red zone. It deserves to be watched very carefully going forward.
ProShares S&P 500 short fund (SH) – Purchase levels of this short fund, which have been declining, were unchanged last week at 12%. It is still near the green zone as a number of investors continue to short this market as prices move higher. This indicator is positive for the stock market
ProShares Bear/Bull Ratio – The ratio of ProShares investors buying short funds versus long funds fell to 75%. This is +3 on the ranking scale and just slightly the bullish side of neutral. While many investors are now bullish, there is still a significant amount of money going into short funds. This is positive for a continuation of the rally
ProShares Ultra Pro Bear/Bull Ratio – The ratio of the money going into Ultra Pro short funds versus Ultra Pro long funds is currently 63%. This is zero on the ranking scale, which is completely neutral.
The summary ranking of all six metrics of investor activity is +2. This is one more than the investment survey ranking. But it is also far from being too bullish. This is another positive sign for higher stock prices.
The Master Sentiment Indicators
We created two master sentiment indicators. Each is a composite indicator made by combining some of the indicators you’ve just seen into one.
The master sentiment indicator, called the MSI, is for long term trends and is updated weekly.
The other, called the short term master sentiment (ST-MSI), is composed of seven indicators. It is updated daily.
Let’s first look at the long term MSI.
The Master Sentiment Indicator (Sentiment King)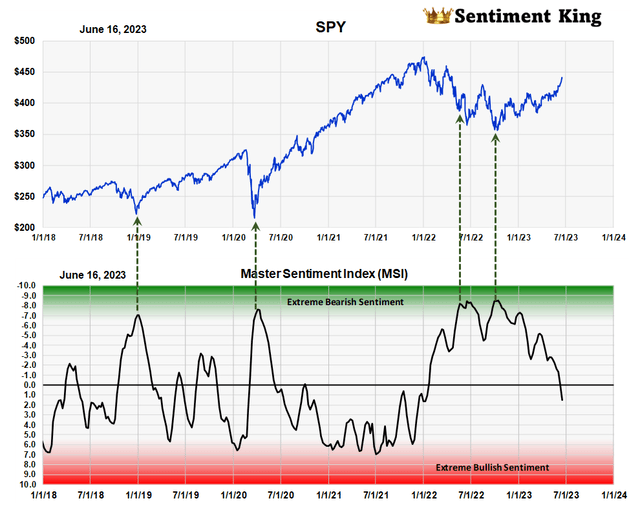
After reaching extremely bearish readings last summer and in October, as indicated by the two right arrows, the indicator has finally passed into the neutral area and is moving towards the red zone, which represents extreme bullish sentiment.
As you can see, however, we’re not there yet. This is a strong indication that prices will continue to move higher. There’s never been a major decline since 2007 without this composite indicator first moving into the red zone.
The ST-MSI
The chart below is a graph of the short term master sentiment indicator (ST-MSI). It measures shorter term changes in investor sentiment.
This chart at +5 is more bullish than the long term MSI but it still has a ways to go before it becomes worrisome. So right now it too is pointing to higher prices like the MSI.
Short Term Master Sentiment Indicator (Sentiment King)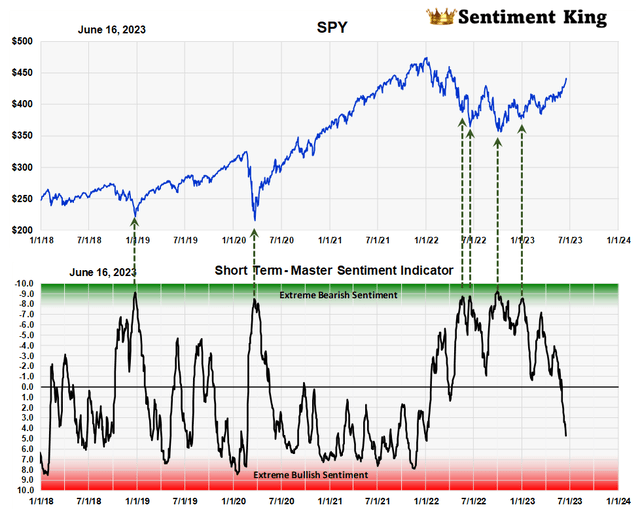
Conclusion
Investor surveys and trading activity point to rising bullishness, but the readings are nowhere near the extreme readings that normally occur before prices begin a major correction. We get the same bullish message from the MSI and ST-MSI composite indicators. We could experience a 5% correction, but we should not begin a significant price decline from here.
The Sentiment King
At the Sentiment King we measure how bullish or bearish investors are. No economic indicator correlates better with locating market tops and bottoms than investor sentiment.
Read the full article here

