It’s been about two months since I announced that I’m continuing to avoid CSX Corp. (NASDAQ:CSX) in an article with the very original title “CSX Corp.: Continuing to Avoid.” In that time, the shares are up about 9% against a gain of about 6% for the S&P 500. Granny Doyle strikes again! Since they’ve posted results since, I thought I’d review those to decide whether or not I should join the party. I’ll review the financials, paying particular attention to the money spent on buybacks over the past year. I’ll compare those to the valuation, putting the valuation in the context of the risk-free rate, given that, in my view at least, the age of “TINA” is over (for the moment at least).
Welcome to the “thesis statement” portion of my article. It’s here where I give you the “gist” of my thinking, so you can get in, and then get out before being exposed to too much of my tiresomeness. I write this summary very near the beginning of each of my articles because I imagine it would make your lives better, and I’m absolutely driven by a desire to make your lives better. You’re welcome. I’m going to continue to avoid CSX for a few reasons. While the company has posted financial results that can only be described as “excellent”, I’m not a fan of the valuation. Additionally, I think it was very irresponsible for management to remain parsimonious with the dividend while spending $4.7 billion on buybacks while also increasing debt by $1.58 billion. In my view, that was not a “shareholder friendly” move, since the valuation associated with the retired price was hardly compelling. In a world where an investor can get risk-free returns such as these, why would they buy a stock that’s yielding so little? In other words, investing is about paying as little as possible to get as much as possible, not the reverse.
Financial Snapshot
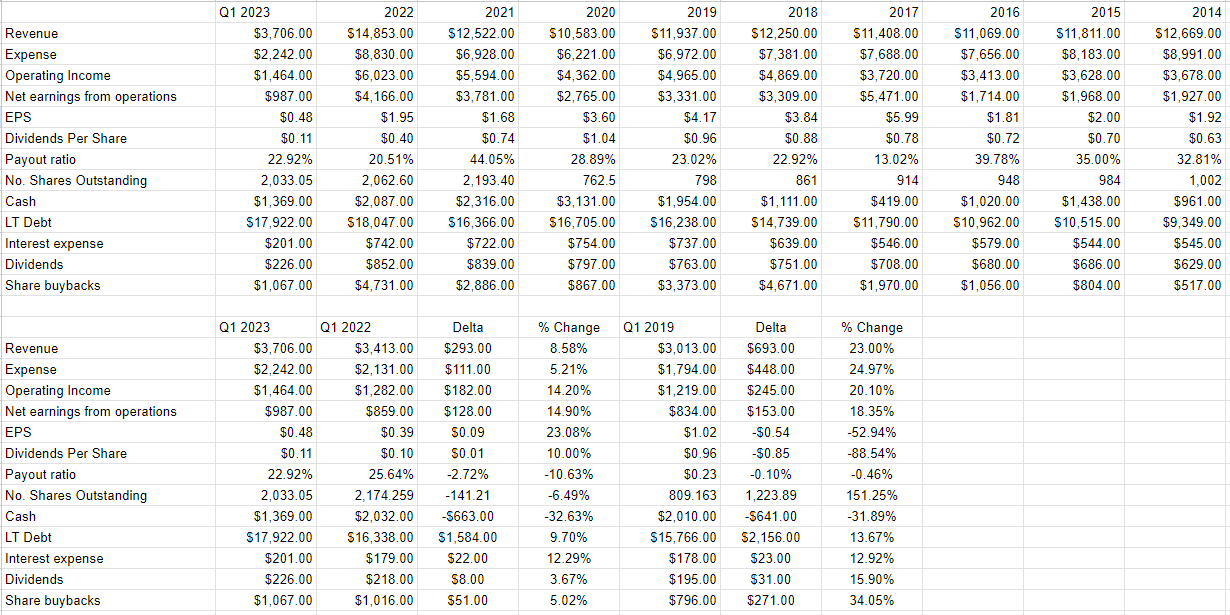
I’d say the most recent quarter was reasonably good when compared to the same period in 2022. That’s saying something, because 2022 was a high point for revenue, and the second-highest level of profitability ever. So, the company seems to have some operational momentum behind it. The great performance of the most recent quarter looks even more obvious when we compare the period ending March 31, 2023, to the same period in 2019. Revenue and net income are higher now by 23% and 18.4% respectively. In my view, a company that improves to this degree in four years should be classified as a “growth” business.
It’s not all sunshine and animated bluebirds over at CSX, though. While the company has been generating ever higher revenue and profits, it’s been adding debt. Long-term debt has grown by about 14% over the past four years, which is startling in my view. At the same time, cash has dropped by about 32%, so the capital structure has deteriorated. The debt here obviously increases the level of risk. All of the above prompts a question from me: if the company has been growing sales and profits, why is the debt higher today? One of the obvious answers to this question involves buybacks. The company is returning capital to shareholders, but is favouring buybacks when it does so. While the payout ratio sits at a rather meagre 23%, the company has spent about $5.8 billion on buybacks from between January 1, 2022, and March 31, 2023. That deserves comment, and so I’m about to offer comment on that score.
A Billion Here, A Billion There
As I just wrote, over the past five quarters, the company has spent about $5.798 billion buying back stock. In my view, that is significant in light of the fact that at the same time, the company has debt on the books of just under $18 billion. I thought I’d review the buyback, to see if it makes sense from the shareholder’s point of view. In order to aid in this effort, I’ve put the following table together for your enjoyment and edification.
CSX Buyback Activity March 2022-March 2023 (CSX filings)
We can see from the table, that between March 31, 2022, and March 31, 2023, the company retired 141,205,030 shares. We can also see that the company spent about $1.016 billion on buybacks between January 1, 2022, and March 31, 2022. Additionally, the company spent $4.731 billion on buybacks throughout 2022. We also know from filings that the company spent $1.067 billion on buybacks from January 1-March 31 of 2023. Applying the arithmetical skills not so lovingly beaten into me by the good sisters at Holy Spirit School years ago, I’ve been able to work out that the company spent $4.782 billion on buybacks between March 31, 2022, and March 31, 2023. Now, using some of the same arithmetical skills I acquired many, many decades ago, I was able to work out that the company retired these shares at an average price of about $33.87 per share.
If you’ve read my stuff often, you know that I don’t judge the quality of a buyback based only on whether the current share price happens to be lower or higher than the retired price. I judge that price on a valuation basis, so please “put a pin in” the $33.87 price.
CSX Corp. Financials (CSX Corp. investor relations)
The Stock
I treat the business and the stock that supposedly represents the business to be two distinctly different things. The business makes money by offering bulk transportation services. The stock, on the other hand, is a scrap of virtual paper that gets traded around in a public marketplace, and its movements are driven by the crowd’s ever-changing moods. The crowd may become enamoured of a given stock because of an optimistic forecast put out by a popular analyst. The stock may move higher or lower because of expected changes in interest rate policies. The crowd may gain confidence because of 401(k) flows into various investment plans. Either way, the stock is often a very poor proxy for the underlying business, which is why I treat it as a separate element.
In my experience, the only way to profitably trade stocks is by buying when crowd expectations become too pessimistic, and selling when the crowd becomes too optimistic. Another way to say “too pessimistic” is “cheap” which is why I like to buy shares that are cheaply priced. I should also point out that no one’s going to give you the shares of a wonderful company for a cheap price. In order to acquire shares cheaply, the company in question has to have some “hair” on it. There have to be identifiable problems, and in my experience, if someone isn’t rushing to the comments section of your articles to tell some other internet stranger (me in this case) how wrong I am, then something’s wrong.
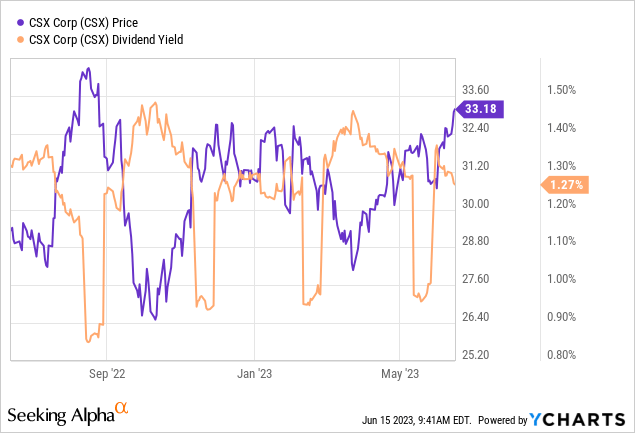
Anyway, I measure “cheap” in a few ways, ranging from the simple to the more complex. On the simple side, I like to look at the ratio of price to some measure of economic value, like earnings, sales, book value, and the like. I want to see a company trading at a discount to both its own history and the overall market. When I last reviewed CSX, the PE was about 15.7, and it’s now about 4% more expensive per the chart below. Also, the dividend yield is about 6% lower than it was, per another chart below. Significantly, the dividend yield is about 392 basis points lower than the risk-free rate.

Source: YCharts

Source: YCharts
I previously suggested stock investing is about playing expectations, by buying when the crowd’s expectations are too dour, and selling when the crowd becomes too rosy. I want to try to quantify expectations as much as possible, and to do that I turn to the works of Stephen Penman and/or Mauboussin and Rappaport. The former wrote a great book called “Accounting for Value” and the latter pair recently updated their classic “Expectations Investing.” These both consider the stock price itself to be a great source of information, and the former in particular helps investors with some of the arithmetic necessary to work out what the market is currently “thinking” about the future of a given business. This involves a bit of high school algebra, where the “g” (growth) variable is isolated in a standard finance formula. Applying this approach to CSX at the moment suggests the market is assuming that earnings will grow at a rate of about 5.4% in perpetuity, and this is up from the previous forecast of about 5%. This is fairly optimistic in my view.
In my view, the shares range between “fairly priced” and “expensive.” Additionally, an investor can take on far less risk by buying government securities, and earn nearly 4% more in the bargain. Taking on more risk with stocks while being paid considerably less makes little sense to me. The spread between the risk-free rate and the dividend yield may improve if the company decided to increase the payout ratio above 20%, but instead, management decided to “return money to shareholders” via the buyback described earlier. It’s time to review that buyback.
Reviewing the Buyback
To refresh your memory, earlier in this article I pointed out that between March 31, 2022, and March 31, 2023, the company spent $4.782 billion of owner capital to buy back shares at an average price of about $33.87. I want to now add a bit of context here. This figure represents about 27% of long-term debt. It is also about 5.5 times the amount of money the company spends on dividends in a given year. With that context out of the way, it’s worth pointing out that the company spent about 16.7 times earnings to retire shares over the past year. When I compare this valuation to the valuation on offer over the past decade, I’d say that management slightly overpaid for these shares. In my view, this buyback was not the best use of that capital. Better would have been to release a special dividend to owners. Alternatively, the balance sheet would have been much stronger, and the company could have saved about $200 million of interest payments if they paid down debt.
Read the full article here


