
This is a follow up to the April 1st article, “XLE Or XOP? The Energy Sector Is Powering Up.” The message here is that energy stocks have finished their consolidation and are ready to move substantially higher.
In this article we will update the indicators we used in the April article. They’re indicators that show what investors are doing and thinking about oil stocks. Their actions point to higher prices for oil stocks. It is our belief at the Sentiment King that investor actions and emotions can help an investor locate major turning points in markets.
Since the price of energy stocks are closely correlated with the price of oil, a reliable forecast of energy stocks must include a forecast for crude.
Oil and “Commitment of Trader’s” Data Are Positive
The chart below shows the price of crude oil from 2006 to present. The important point is that prices have been correcting now for over a year from a high of around $120 down to $70, a decline of 42%. It would be unusual to expect more.
Oklahoma Crude Oil Prices (Sentiment King)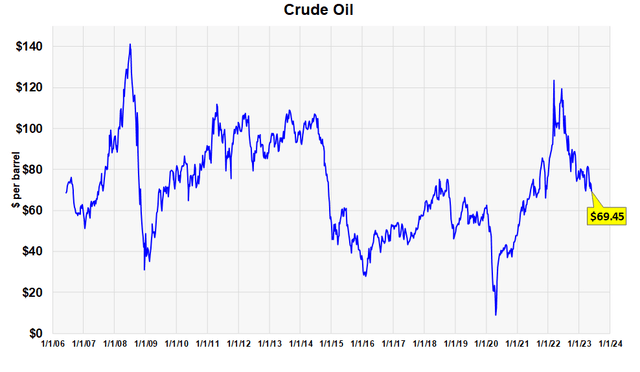
The graph below is from the commitment of trader’s data in the oil futures market. It graphs the short position of the asset managers. High short positions normally occur at price lows right before a rally. These are indicated by the black arrows. In our opinion, the current ratio of 24.7% is high enough to signal a low in the market.
Commitment of Trader Data of Asset Managers in Oil Futures (Sentiment King)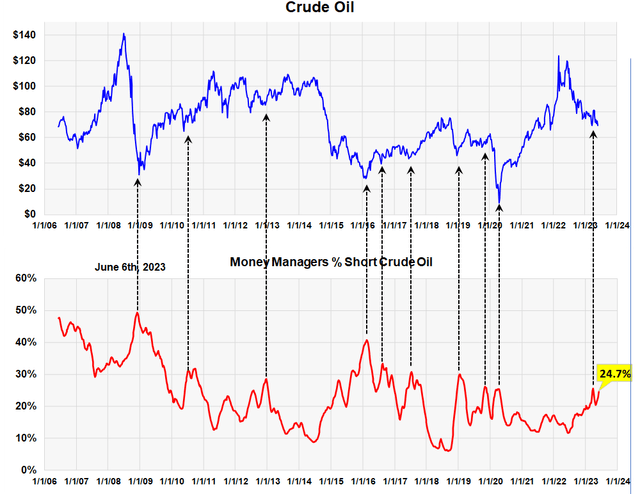
Put Buying in Energy Stocks Points Higher
Measuring “Put” buying in energy stocks and ETFs is a good way to measure what investors are thinking about energy stocks. If too many investors buy “puts” expecting lower prices, they invariably go higher. We’re going to show you, using three charts, the ratio of money going into “puts” compared to “calls” in two energy ETFs and in all 160 energy stocks. Call three point to the same conclusion in varying degrees.
The first chart is the ratio of the amount of money going into “puts” versus “calls” in the largest energy ETF – Energy Select Sector SPDR® Fund ETF (XLE). It shows that there is currently 3.9 times more money going into puts than calls. The last time this happened was in 2020 at the major, March low indicated by the black arrow on the left.
Premium Puts to Calls Ratio of XLE (Sentiment King)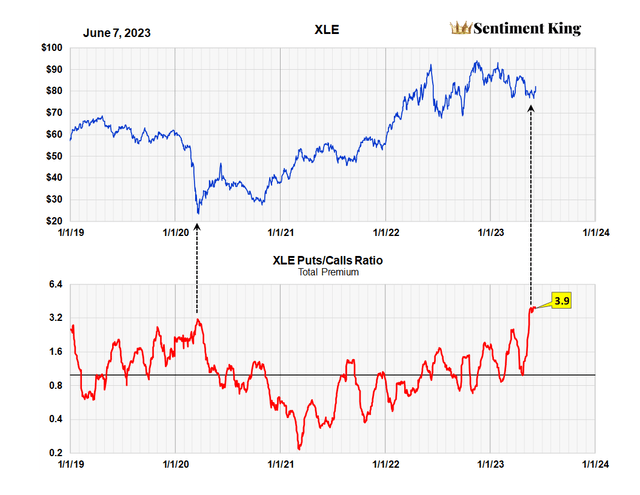
This second chart graphs the “puts to calls” ratio of the second largest energy ETF – SPDR® S&P Oil & Gas Exploration & Production ETF (NYSEARCA:XOP). Data from the CBOE indicates that over 15 times more money is going into put purchases than call purchases. While a few high ratios in 2019 didn’t signal significant moves in XOP, overall, the record is rather good.
Premium Puts to Calls Ratio of XOP (Sentiment King)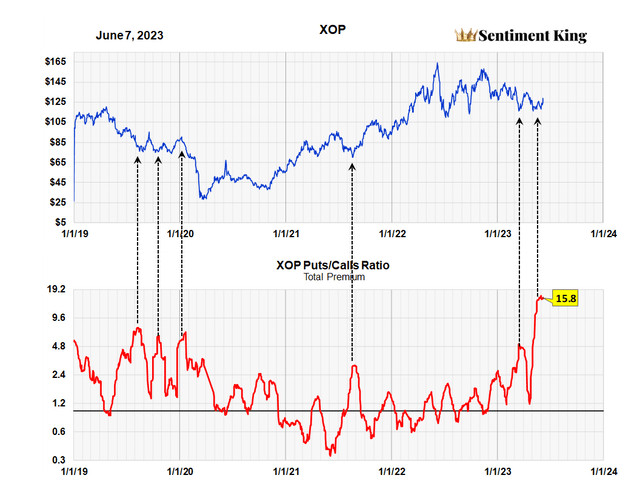
This last chart is the puts and calls ratio of all 160 energy stocks that trade options. One hundred and sixty stocks makes it the broadest based “put to calls” ratio for the industry sector there is.
In all 160 stocks, there’s now 1.4 times more money going into “put” contracts than “call” contracts. We’ve indicated with black arrows, critical moments in the past when we had high ratios similar to this.
The fact that all three “puts to calls” ratios point to higher prices is an important indicator to us that oil stocks and energy ETFs like XLE and XOP are headed higher.
Premium Puts to Calls Ratio of All 160 Energy Stocks (Sentiment King)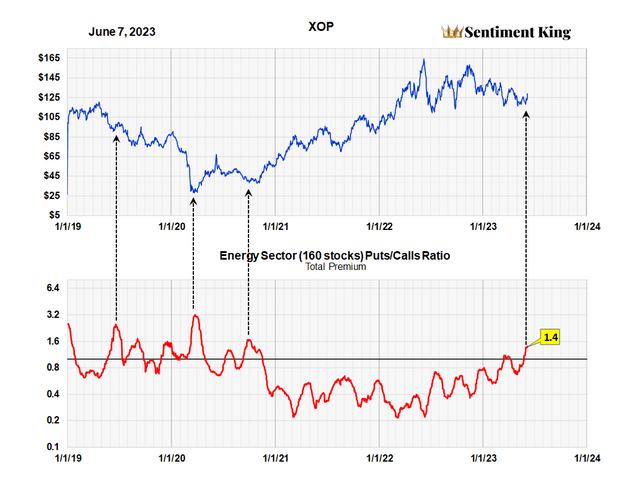
Heavy Put Buying in Energy Stocks Confirms the Ratios
We like to confirm the “puts and calls” ratio by looking at the actual amount of money buying puts. It’s important to us that this number also be large. The ratio alone doesn’t assure this because you’re comparing puts against calls which takes out the absolute number.
So, how does the actual amount of money going into energy “puts” measure up? The next three charts provide the answer.
The first chart below shows that just over $23 million a day is purchasing XLE puts. History shows this is a relatively large amount. The black arrows point to past moments when this amount was high and to us, the current large number confirms the puts and calls ratio in the XLE.
Total Put Buying in XLE (Sentiment King)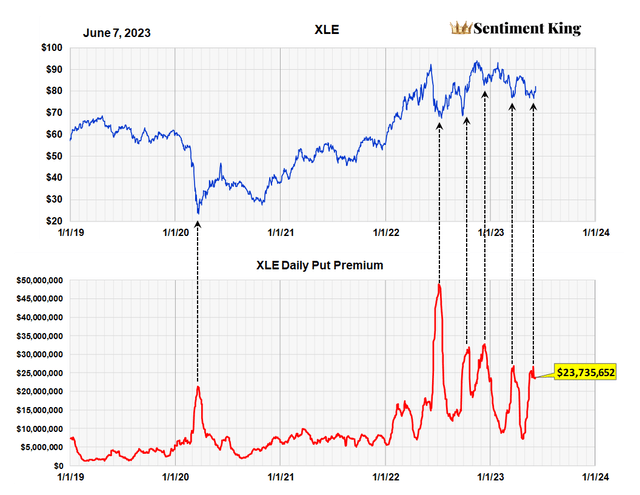
The next chart shows the same metric for the second largest energy ETF – XOP. With this ETF, over $44 million is going into XOP puts. This is a record amount by a wide margin and, our opinion, also confirms the high “puts to calls” ratio in this ETF.
Total Put Buying in XOP (Sentiment King)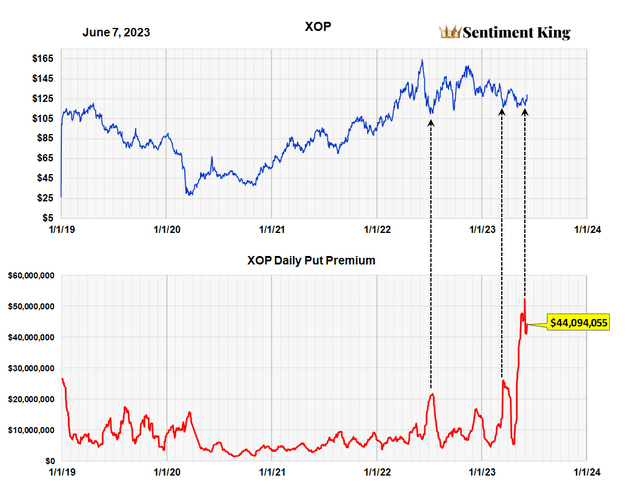
This last chart graphs the total amount of put buying going into all 160 energy stocks. It’s therefore the most broad based metric and it shows currently just over $96 million a day in going into puts in all 160 stocks.
The graph indicates that we’re at levels in the past that occurred at major price lows in energy stocks. We are using the price of XOP in the chart as the proxy for the 160 energy stocks.
Total Put Buying in All 160 Energy Stocks (Sentiment King)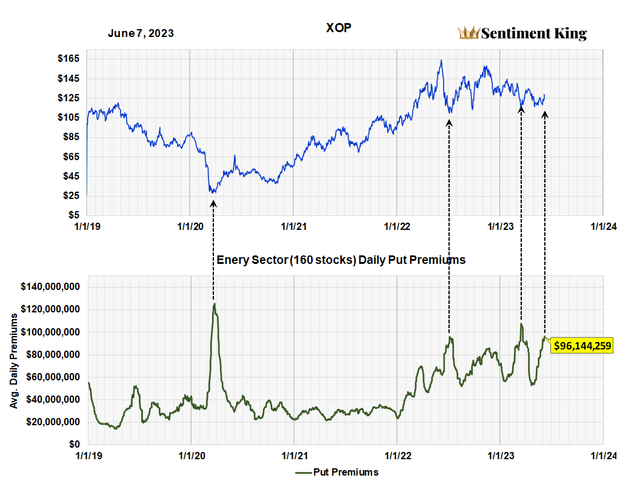
XLE or XOP?
For those looking to invest in the energy sector, we advise both XLE and XOP. They are the most well correlated energy ETFs that are practically guaranteed to advance with a general increase in the price of energy stocks. We prefer dependability over profit.
The largest energy ETF is XLE, which has $35 billion in assets. XOP has assets worth $3.4 billion, making it the fourth largest.
As we said both are strongly correlated to the price of crude oil. Over the last five years XLE has a correlation factor of 82% while XOP is correlated 71%. How strongly two variables are related to one another is determined by a correlation coefficient, known as a correlation factor. A very strong positive link exists between two variables when their correlation factors are 70% or greater, indicating that if one variable rises, the other typically tends to climb as well.
While increasing oil prices should boost the performance of both ETFs, we believe XOP may perform slightly better. One reason is that it has a higher potential return because it is a little more volatile. For instance, XLE has increased by 198% and XOP by 242% since the oil sector’s price low on April 16, 2020.
Summary
We believe option activity in the energy sector, plus buying activity by asset managers in the oil futures market, point to the start of a major advance in both oil and energy stocks.
We think investors should purchase either XOP or XLE as soon as possible to participate in the move. We expect it to be an intermediate to long term price move; this is not a short term call.
Read the full article here

