
Introduction
Every year the Russell Indexes are rebalanced to bring in new stocks and remove underperforming stocks. The FTSE Russell calls this event the annual reconstitution process. It begins with evaluations and “rankings” in May and moves to the June-transition month. For 2023, beginning on May 19th, the preliminary selection lists are communicated to the markets. Updates are provided on May 26, June 2, June 9, 16, and 23rd with the reconstituted indexes taking effect after the close on June 23 this year.
FTSE Russell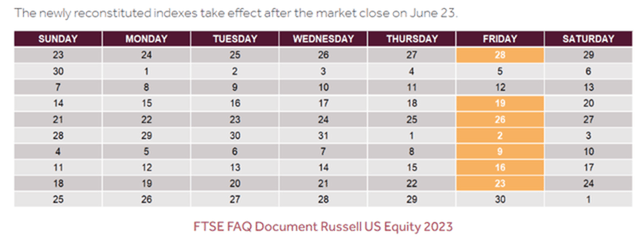
Over the years I have tested many published scholarly studies in simulated trading portfolios to measure the claimed abnormal excess returns. These investigative bonus articles include much more detail for members of my investing group, but samples and summaries of different prior test results can be read here:
Review of the Russell 2000 Index
The Chinco & Sammon (2022) study found statistically significant results that the stocks switching from the Russell 2000 to the larger cap Russell 1000 index greatly outperformed those stocks switching in the opposite direction on the reconstituted index. We will review the progress of these returns the past 11 months, but first we have to consider the broader market in which these annual studies have been conducted:
FinViz.com VMBreakouts.com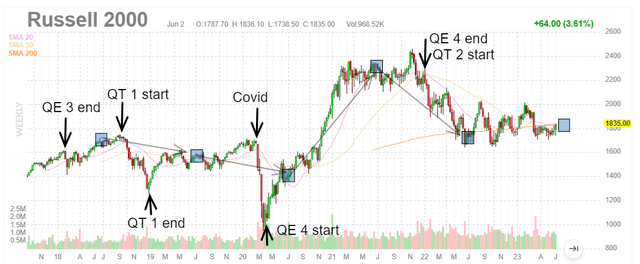
Over the past 6 years of Russell anomaly studies, the Russell 2000 has seen enormous volatility. As I have indicated on the chart much of the volatility has corresponded with Federal Reserve quantitative easing (QE) and tightening programs (QT) to stimulate the market or control inflation. One of the largest events, of course, was the Covid pandemic that resulted in QE 4, the largest Fed stimulus program in US history on March 23, 2020. These major interventions have certainly confounded many anomaly studies over the years and it is important to keep these larger market forces in mind.
Some additional background on the Fed QE and QT policy programs is available here: Fed Promises Faster Moves On Largest QT Program In History
How the 2022-2023 test is going
For 2022 there were 50 stocks that migrated between the two indices. To test the Chinco and Sammon research results I constructed two portfolios of the “Rising 1000 Index stocks” and the “Lowering 2000 Index stocks.” Comparing the two portfolio results were highly significant for July and clearly validated the published findings. The results again were statistically significant through September, November and again June, 2023. The significance of these results provide strongly supporting evidence that this anomaly is able to deliver above average returns. Details on the prior interim updates are available here:
The Current 11 Month Results
The Rising 1000 portfolio has 11 out of 21 (52.3%) stocks with positive returns and average returns of -1.71%. The Lowering 2000 portfolio has 8 out of 29 (27.5%) stocks with positive returns and average losses of -19.36%. The 17.65% difference between these two populations stayed significantly different over the past year at statistically meaningful levels.
Stocks Moving Up to Russell 1000 index
Nearly even results between stocks gaining and stocks losing from June 2022.
VMBreakouts.com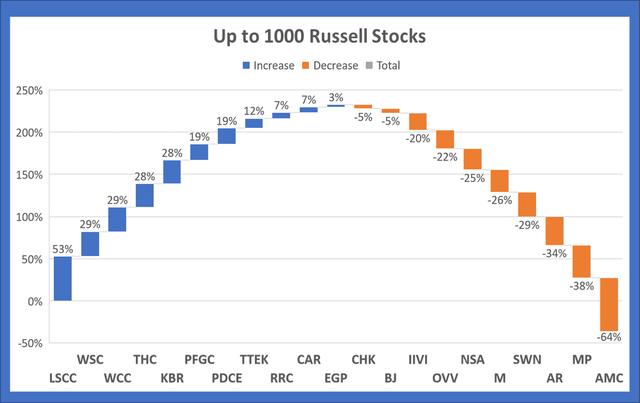
Stocks Moving Down to Russell 2000 index
Strongly negative cumulative returns with many more negative stocks.
VMBreakouts.com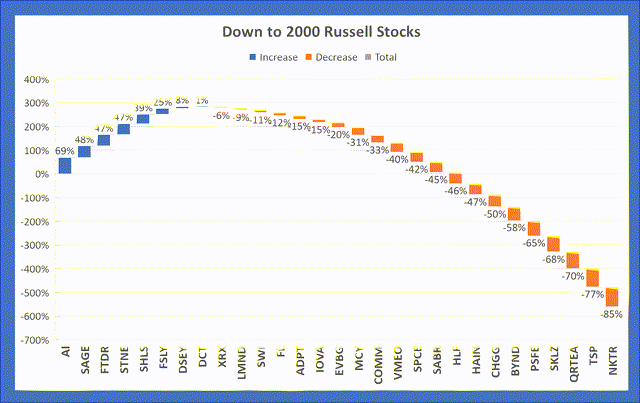
5 Month Results Through November 2022
The Rising 1000 portfolio has 15 out of 20 (75.0%) stocks with positive returns and average gains of +9.78%. The Lowering 2000 portfolio has 8 out of 29 (27.5%) stocks with positive returns and average losses of -12.96%. The 22.74% difference between these two populations are continuing to widen with statistically significant outcomes. There are many ways to compare the two populations, but I think the significance of this anomaly will jump out at you best from a comparison of the two waterfall charts.
Stocks Moving Up to Russell 1000 index
Highly positive results from much larger percentage of stocks gaining.
VMBreakouts.com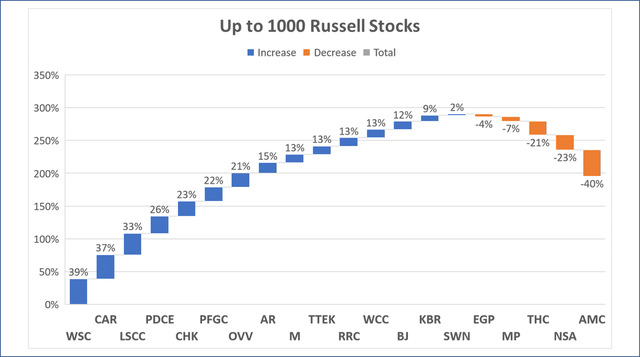
Stocks Moving Down to Russell 2000 index
Strongly negative cumulative returns with many more negative stocks.
VMBreakouts.com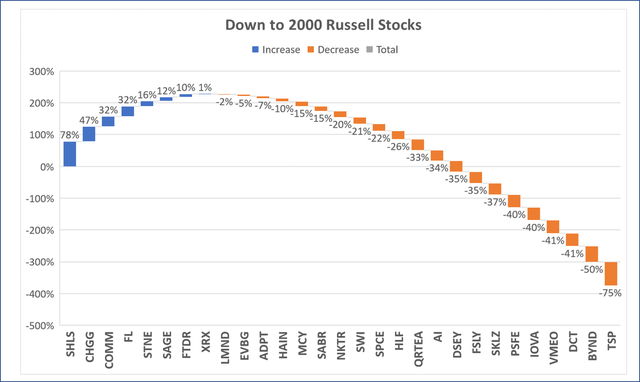
The current multi-level study began from the June reconstitution period and has run through June 2nd, 2023. Most published research finds that the strongest effects of the index anomaly occur in the one to three month period after reconstitution. However much of the scholarly research I have tested previously did not extend beyond the first month after reconstitution in June.
Previous Russell 2000 anomaly studies
So here is a quick recap of some of the different anomalies from the tested research as summarized below:
1. Cai and Houge (2018) multi-year findings that in the long term a buy/hold Russell 2000 portfolio significantly outperforms any new addition stock portfolios. They found that a buy-and-hold portfolio significantly outperformed the annually rebalanced index by an average of 2.22 percent over one year and by 17.29 percent over five years.
2. Zdorovtsov, Tang, and Onayev (2017) evaluated 14 years of Russell 3000 reconstitution behavior between 2000 and 2013 and observed strong positive post-event returns for additions to the index. The strongest results were found out to the longest measured post-event period of 21 days with average value-weighted gains of +7.46%.
3. Most recently according to Chinco & Sammon (2022), they document the strongest post reconstitution positive return comes from stocks that move up to the larger cap Russell 1000 index from the 2000 index.
Chinco & Sammon (2022)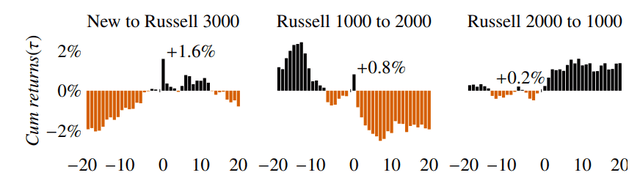
4. In the Madhavan (2003) study he found several profitable anomalies in the reconstitution data between 1995 through 2001. One element was that the mean return in the month of July for the spread portfolio produced negative -7% average returns following the reconstitution date, suggesting a strong mean reversion. In other words, strong average +6.8% gains in the long additions/short deletions portfolio for June reverted to -7% for July across his seven year study.
The Chinco & Sammon (2022) study found statistically significant results that the stocks switching from the Russell 2000 to the larger cap Russell 1000 index greatly outperformed those stocks switching in the opposite direction on the reconstituted index.
Chinco & Sammon (2022)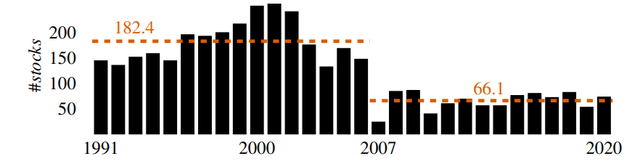
Since the 2007 FTSE/Russell bandwidth rule, there has been a significant decline in the average number of qualified switchers from 182 stocks down to 66 stocks. Last year only 50 stocks qualified for my test study. We will see how many qualify when the preliminary changes are completed.
These results strongly validate the Chinco & Sammon (2022) well beyond their measured period of testing. These results are also very promising in one of the worst market conditions in decades. This test of the Chinco study supports the effectiveness of their findings to apply for potentially even better results in better market conditions. I plan to use this anomaly in trading for 2023-2024. The range of stocks we can use from next year’s reconstitution will be valuable for the Premium Portfolio and small cap weekly breakout picks.
Conclusion
These results strongly validate the Chinco & Sammon (2022) well beyond their original measured period of testing. These results were also very promising through 2022 in one of the worst market conditions in decades. This test of the Chinco study supports the effectiveness of their findings to apply for potentially even better results in better market conditions.
Many scholarly research studies have been published about reconstitution anomalies surrounding the FTSE Russell, S&P 500 and other major indices. The annual reconstitution process of the Russell index lends itself well to research and thorough analysis every June.
Be sure to “Follow” for the next update on the stock selections and future tracking articles.
All the very best!
JD Henning, PhD, MBA, CFE, CAMS
References
Cai, J. & Houge, T. (2018). Long-Term Impact of Russell 2000 Index Rebalancing. Long-Term Impact of Russell 2000 Index Rebalancing
Chinco, A. & Sammon, M. (2022). Excess Reconstitution-Day Volume. Available at http://dx.doi.org/10.2139/ssrn.3991200
Zdorovtsov, V., Tang, O. & Onayev, Z., Predatory Trading Around Russell Reconstitution (2017). Available at http://dx.doi.org/10.2139/ssrn.3021022
Read the full article here

