
Investors often find that companies with a history of increasing dividends perform better than those without. When a company’s management announces a dividend increase, it typically indicates strong business performance and a dedication to rewarding shareholders. I watch companies with a proven record of growing their dividends, providing you with the latest updates on upcoming increases. The following lists offer valuable insights into stocks raising their dividends in the coming week, especially relevant in today’s inflationary climate.
This list is a trimmed-down version, only covering dividend increases. A full upcoming dividend calendar is always available here.
How I Created The Lists
I created the information below by combining the “U.S. Dividend Champions” spreadsheet hosted here with upcoming dividend information from NASDAQ. This meshes metrics about companies with dividend growth history with upcoming dividend payments. These companies all have a minimum five-year dividend growth history.
Companies are required to have higher total dividends paid out each year. Therefore, a company may not raise its dividend each calendar year, but the total annual dividend can still increase.
What Is The Ex-Dividend Date?
The ex-dividend date marks the eligibility cut-off point for the upcoming dividend or distribution. To qualify, you must have purchased shares by the close of the preceding business day. For example, if the ex-dividend date falls on a Tuesday, you must have bought (or already owned) the shares by the market close on Monday. Note that if the ex-dividend date is on a Monday (or a Tuesday if Monday is a holiday), you must have acquired the shares by the prior Friday.
Dividend Streak Categories
Here are the definitions of the streak categories, as I’ll use them throughout the piece.
- King: 50+ years
- Champion/Aristocrat: 25+ years
- Contender: 10-24 years
- Challenger: 5+ years
| Category | Count |
| King | 1 |
| Champion | 3 |
| Contender | 6 |
| Challenger | 5 |
The Dividend Increasers List
Data has been sorted by the ex-dividend day (ascending) and then by the streak (descending):
| Name | Ticker | Streak | Forward Yield | Ex-Div Date | Increase Percent | Streak Category |
| LyondellBasell Industries NV Ordinary Shares | (LYB) | 12 | 5.37 | 26-May-23 | 5.04% | Contender |
| RLI Corp. Common Stock | (RLI) | 48 | 0.85 | 30-May-23 | 3.85% | Champion |
| FactSet Research Systems Inc. | (FDS) | 25 | 1.02 | 30-May-23 | 10.11% | Champion |
| Materion Corporation | (MTRN) | 11 | 0.51 | 30-May-23 | 4.00% | Contender |
| NACCO Industries, Inc. | (NC) | 5 | 2.58 | 30-May-23 | 5.31% | Challenger |
| Expeditors International of Washington, Inc. | (EXPD) | 29 | 1.23 | 31-May-23 | 2.99% | Champion |
| QUALCOMM Incorporated | (QCOM) | 21 | 3.11 | 31-May-23 | 6.67% | Contender |
| ManpowerGroup | (MAN) | 13 | 4.02 | 31-May-23 | 8.09% | Contender |
| Watts Water Technologies, Inc. Class A | (WTS) | 11 | 0.89 | 31-May-23 | 20.00% | Contender |
| Advanced Drainage Systems, Inc. | (WMS) | 9 | 0.58 | 31-May-23 | 16.67% | Challenger |
| Hamilton Beach Brands Holding Company Class A Common Shares | (HBB) | 6 | 4.57 | 31-May-23 | 4.76% | Challenger |
| Ashland Inc. | (ASH) | 5 | 1.76 | 31-May-23 | 14.93% | Challenger |
| PepsiCo, Inc. | (PEP) | 51 | 2.74 | 1-Jun-23 | 10.00% | King |
| First Merchants Corporation | (FRME) | 12 | 4.95 | 1-Jun-23 | 6.25% | Contender |
| Houlihan Lokey, Inc. Class A | (HLI) | 8 | 2.55 | 1-Jun-23 | 3.77% | Challenger |
Field Definitions
Streak: Years of dividend growth history are sourced from the U.S. Dividend Champions spreadsheet.
Forward Yield: The new payout rate is divided by the current share price.
Ex-Dividend Date: This is the date you need to own the stock.
Increase Percent: The percent increase.
Streak Category: This is the overall dividend history classification of the company.
Show Me The Money
Here’s a table mapping the new rates versus the old rates. It also reiterates the percentage increase. This table is sorted similarly to the first table (ex-dividend day ascending, dividend streak descending).
| Ticker | Old Rate | New Rate | Increase Percent |
| LYB | 1.19 | 1.25 | 5.04% |
| RLI | 0.26 | 0.27 | 3.85% |
| FDS | 0.89 | 0.98 | 10.11% |
| MTRN | 0.125 | 0.13 | 4.00% |
| NC | 0.207 | 0.218 | 5.31% |
| EXPD | 0.67 | 0.69 | 2.99% |
| QCOM | 0.75 | 0.8 | 6.67% |
| MAN | 1.36 | 1.47 | 8.09% |
| WTS | 0.3 | 0.36 | 20.00% |
| WMS | 0.12 | 0.14 | 16.67% |
| HBB | 0.105 | 0.11 | 4.76% |
| ASH | 0.335 | 0.385 | 14.93% |
| PEP | 1.15 | 1.265 | 10.00% |
| FRME | 0.32 | 0.34 | 6.25% |
| HLI | 0.53 | 0.55 | 3.77% |
Additional Metrics
Some different metrics related to these companies include yearly pricing action and the P/E ratio. The table is sorted the same way as the table above. A value investor may find stock ideas with those companies near their 52-week lows, as they could provide more margin of safety and inflated yield.
| Ticker | Current Price | 52 Week Low | 52 Week High | PE Ratio | % Off Low | % Off High |
| LYB | 89.56 | 70.59 | 109.7 | 24.78 | 27% Off Low | 18% Off High |
| RLI | 126.71 | 100.56 | 149.65 | 35.67 | 26% Off Low | 15% Off High |
| FDS | 384.58 | 343.82 | 473.13 | 33.5 | 12% Off Low | 19% Off High |
| MTRN | 102.11 | 64.72 | 121.29 | 50.28 | 58% Off Low | 16% Off High |
| NC | 33.69 | 30.19 | 62.28 | 7.75 | 12% Off Low | 46% Off High |
| EXPD | 112.16 | 85.57 | 119.9 | 24.18 | 31% Off Low | 6% Off High |
| QCOM | 102.99 | 100.67 | 153.86 | 34.93 | 2% Off Low | 33% Off High |
| MAN | 73.16 | 63 | 92.43 | 62.62 | 16% Off Low | 21% Off High |
| WTS | 161.28 | 115.64 | 181.09 | 33.9 | 39% Off Low | 11% Off High |
| HY | 50.54 | 20.55 | 57.61 | 34.61 | 146% Off Low | 12% Off High |
| WMS | 95.78 | 75.02 | 152.82 | 37.11 | 28% Off Low | 37% Off High |
| HBB | 9.64 | 9.13 | 14.81 | 10.18 | 6% Off Low | 35% Off High |
| ASH | 87.29 | 86.64 | 113.98 | 0 | 1% Off Low | 23% Off High |
| PEP | 184.85 | 151.84 | 196.88 | 28.79 | 22% Off Low | 6% Off High |
| FRME | 27.48 | 24.52 | 44.36 | 12.99 | 12% Off Low | 38% Off High |
| HLI | 86.19 | 72.93 | 101.24 | 22.57 | 18% Off Low | 15% Off High |
Tickers By Yield And Growth Rates
I have arranged the table in descending order for investors to prioritize the current yield. As a bonus, the table also features some historical dividend growth rates. Moreover, I have incorporated the “Chowder Rule,” which is the sum of the current yield and the five-year dividend growth rate.
| Ticker | Yield | 1 Yr DG | 3 Yr DG | 5 Yr DG | 10 Yr DG | Chowder Rule |
| LYB | 5.37 | 5.3 | 4.3 | 5.2 | 11.5 | 10.5 |
| FRME | 4.95 | 10.4 | 7.2 | 12.2 | 26.7 | 17.1 |
| HBB | 4.57 | 5 | 5.3 | 19.8 | 24.3 | |
| MAN | 4.02 | 7.9 | 7.7 | 7.9 | 12.2 | 11.8 |
| QCOM | 3.11 | 10.3 | 6.6 | 5.7 | 11.6 | 8.8 |
| PEP | 2.74 | 7 | 6.4 | 7.4 | 7.9 | 10.1 |
| NC | 2.58 | 5.1 | 3 | -1.1 | -6.3 | 1.5 |
| HLI | 2.55 | 23.3 | 19.6 | 21.5 | 24 | |
| MGEE | 2.19 | 5.1 | 4.9 | 4.8 | 4.4 | 7 |
| ASH | 1.76 | 11.7 | 6.8 | 8.3 | 4.1 | 10 |
| EXPD | 1.23 | 15.5 | 10.3 | 9.8 | 9.1 | 11 |
| FDS | 1.02 | 8.5 | 7.3 | 9.7 | 11.1 | 10.7 |
| WTS | 0.89 | 15.4 | 9.3 | 9.6 | 10.6 | 10.5 |
| RLI | 0.85 | 4 | 4.2 | 4.4 | 5 | 5.2 |
| WMS | 0.58 | 9.1 | 10.1 | 11.4 | 12 | |
| MTRN | 0.51 | 4.2 | 4.4 | 4.6 | 5.3 | 5.1 |
Historical Returns
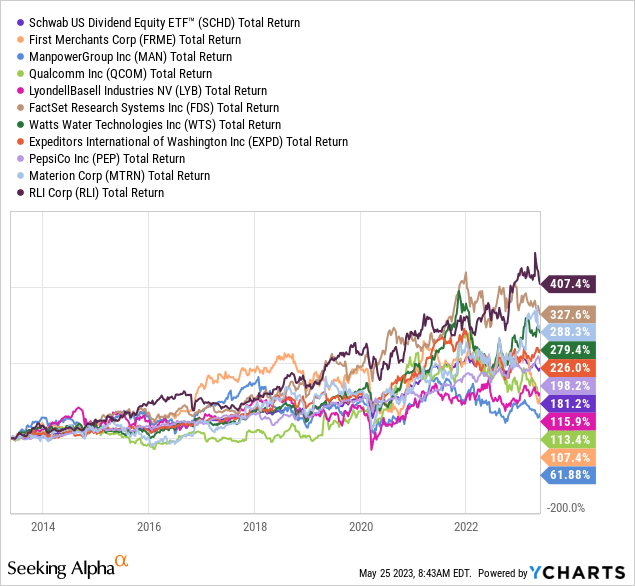
As an investor, I prioritize finding stocks with consistent dividend growth and a track record of outperforming the market. I use the Schwab U.S. Dividend Equity ETF (SCHD) as a benchmark to assess their performance. This ETF has a strong history of exceptional performance, a higher yield than the S&P 500, and a proven record of growing dividends. If you can’t surpass the benchmark, it’s wise to consider investing in it.
Here’s the total return chart of SCHD versus the ten with the highest 10-year dividend growth rate. For reference, SCHD had a total return of 181%. RLI was the top performer with a 407% total return. They were followed by FDS, MTRN, WTS, EXPD, and PEP, all of whom outperformed SCHD. LYB, QCOM, FRME, and MAN brought up the bottom of the pack.
Please do your due diligence before investing, and thanks for reading.
Read the full article here

