Background
This post examines the SPDR S&P Bank ETF (NYSEARCA:KBE) and SPDR S&P Regional Banking ETF (NYSEARCA:KRE).
It is organized in three parts.
- Part I: Ugly Truth
- Part II: Moments of Beauty
- Part III: Risks
This post compares KRE and KBE quarterly performance since their inception in 2006 to the S&P 500, nine sectors, Berkshire Hathaway, Inc. (BRK.A)(BRK.B), and two funds of personal interest to me, the Vanguard Dividend Growth Fund (VDIGX) and AMG Yacktman I (YACKX).
The Financial Select Sector SPDR ETF (XLF) is among the comparisons. As a reminder, XLF includes a mix of financial companies. Five of the top ten holdings are non-banks, including its largest holding at 13.3% of assets, Berkshire Hathaway.
In contrast to KRE which includes only regional banks, KBE includes the nation’s biggest banks like JPMorgan Chase & Co. (JPM), Bank of America Corp. (BAC), Wells Fargo & Co. (WFC), and Citigroup Inc. (C).
| KBE | SPDR S&P Bank ETF |
| KRE | SPDR S&P Regional Banking ETF |
| SPY | SPDR S&P 500 Trust ETF |
| XLB | Materials Select Sector SPDR ETF |
| XLE | Energy Select Sector SPDR ETF |
| XLF | Financial Select Sector SPDR ETF |
| XLI | Industrial Select Sector SPDR ETF |
| XLK | Technology Select Sector SPDR ETF |
| XLP | Consumer Staples Select Sector SPDR ETF |
| XLU | Utilities Select Sector SPDR ETF |
| XLV | Health Care Select Sector SPDR ETF |
| XLY | Consumer Discretionary Select Sector SPDR ETF |
| BRK.B | Berkshire Hathaway Inc |
| YACKX | AMG Yacktman I |
| VDIGX | Vanguard Dividend Growth Inv |
Part I Ugly Truth
US bank stocks are so volatile that a solid case can be made that they, as an investment class, do not belong in any long-term buy-and-hold investment portfolio.
Here’s the evidence.
Returns & Volatility
The following charts compare total return (dividend and price change) of KRE and KBE to the S&P 500, nine sectors, VDIGX, and YACKX.
Total Returns Over Four Timeframes
The next four scatterplot charts compare bank ETFs total return and variation (as measured by standard deviation which we will call volatility) of total return over four timeframes.
Across all comparisons, bank ETFs historically show high volatility and unfavorable total returns.
Looking first at total returns over rolling six months since Q2 2006, we can see that KBE and KRE occupy the ugly upper left portion of the chart below.
Over rolling six-month timeframes since Q2 2006, KRE and KBE deliver consistently low total returns (average approximately 3%) and high volatility. The bank dominated XLF is not much better.
In contrast, nine of the investment alternatives have averaged 5%+ total returns and eight of these have done so with standard deviations less than 15% including the S&P 500.
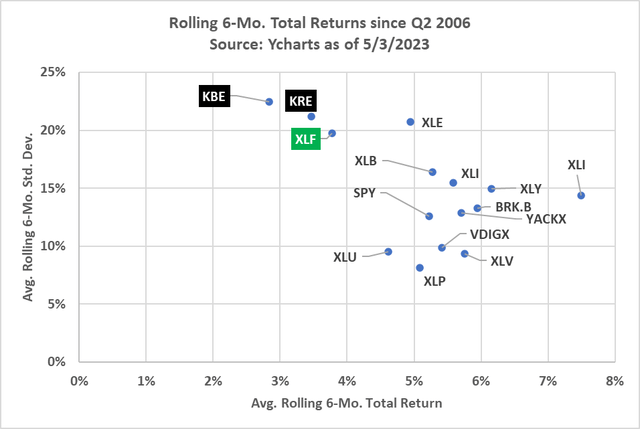
Rolling 6-Month Total Return (YCharts)
The next chart covers rolling 1-year total returns. Results mirror 6-month performance. KRE and KBE occupy the undesirable upper left-hand corner of the chart.
Again, XLF shows the worst performance relative to other sectors as measured by total return, although its volatility trails the energy sector.
All but three of the investment alternatives have generated average rolling 1-year total returns of 10%+ since 2006 in contrast to KBE and KRE that have averaged 4.9% and 6.4%, respectively.
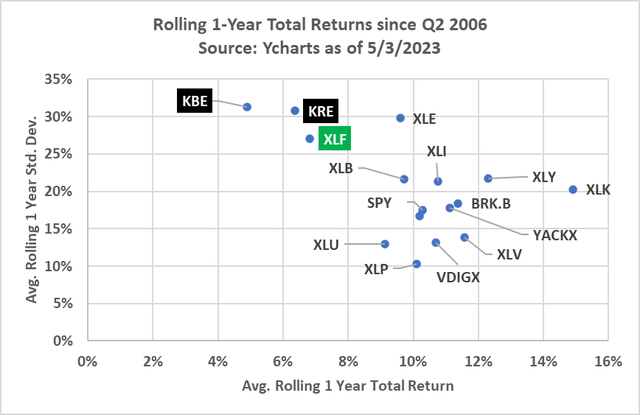
Rolling 1-Year Total Return (YCharts)
KBE, KRE, and XLF show the worst 3-year rolling total returns of the investment alternatives depicted in this next chart. However, the bank and financial ETFs show less volatility than the energy sector ETF and comparable volatility to the technology sector ETF.
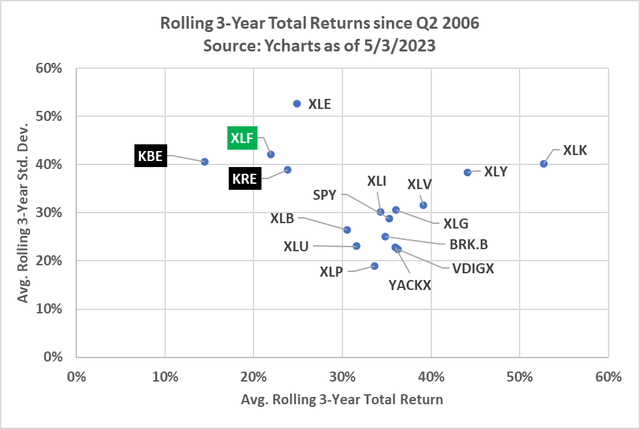
Rolling 3-Year Total Return (YCharts)
Rolling 5-year total returns, for the most part, continue the same story from shorter timeframes, however, three sectors–energy, consumer discretionary, and technology–all show higher volatility. These three higher volatility sectors also generate superior total returns compared to the bank and financial ETFs.
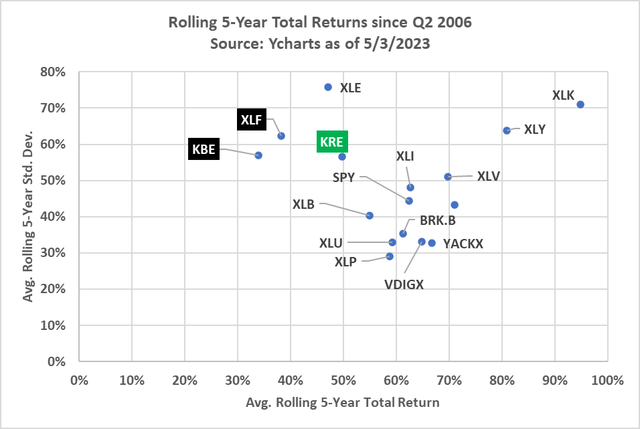
Rolling 5-Year Total Return (YCharts)
Coefficient of Variation: Volatility and Return
The next two bar charts are what I call a poor man’s Sharpe Ratio. For these charts, the coefficient of variation is shown, which is calculated as the standard deviation divided by the average.
The first chart reflects 1-year total returns. Note that KBE and KRE stand tall, which is not a good thing. Lots of volatility and not so much return. In contrast, Consumer Staples, Utilities, Healthcare, and the Vanguard Dividend Growth Fund show the best performance as measured by the CoV measure.
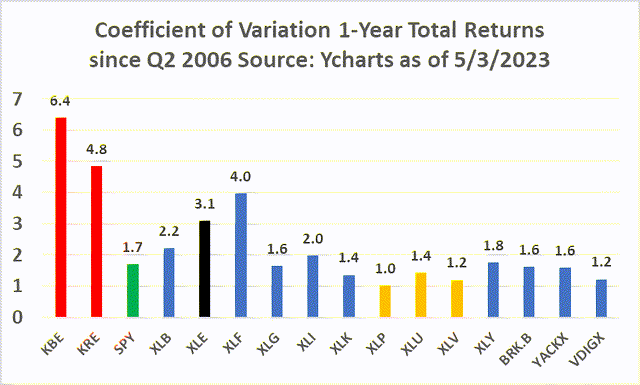
CoV 1 Year (YCharts)
Three-year total returns are interesting. The regional bank ETF compares favorably to the more volatile energy and financial sectors. However, KRE compares quite unfavorably to the S&P 500 and especially the Consumer Products sector as well as the two managed funds, YAKX and VDIGX.
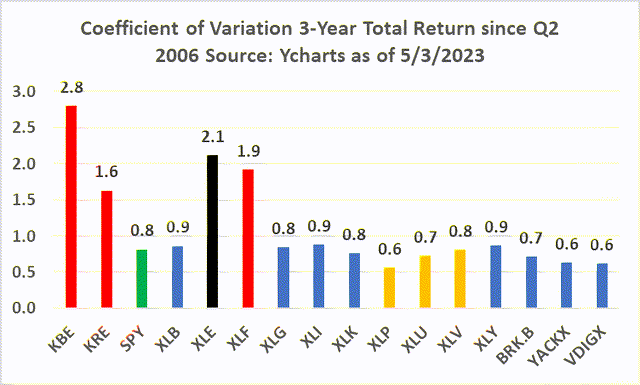
CoV 3-Years (YCharts)
Part II: Bank ETFs’ Moments of Beauty
Reversion to the Mean
Bad days give way to good days in the market just as good days give way to bad ones.
When bank stock prices fall violently, the power of reversion to the mean kicks in. As the data below show, six- and twelve-month total returns greater than 50% have occurred in the past.
Six-Month Total Returns Subsequent to Bank Stock Plunge
Ugly as bank ETFs are over any extended holding period, when bank stocks dive like they have recently, they can provide moments of glorious beauty as a speculative investment.
This first chart below shows on the X-axis the total return by quarter since KBE’s introduction in 2006. The Y-axis shows the total return for the subsequent six months. Note the r-squared of .53. That’s compelling evidence of correlation (correlation is about 71%).
What’s even more interesting are total returns when six-month total returns decline more than -25%. This is germane to our study since KBE’s six-month total return as of May 5 is -29%.
Since 2006 there have been five occasions prior to the current one when the quarter-end six-month total return was worse than -25%. Those quarter-ends are:
- 2Q 2020: -32%. Covid. SPY -3%.
- 1Q 2020: -37%. Covid. SPY -12%.
- 3Q 2011: -32%. Fed. Govt. Non-stop Fines. Buffett buys BAC. SPY -14%.
- 1Q 2009: -58%. Fed. Govt. Threat Takeover Banks. SPY -33%.
- 3Q 2008: -33%. Merrill, Lehman Fail. SPY -12%.
Six-month total returns for KBE six months later:
- 4Q 2020: 67%
- 3Q 2020: 45%
- 1Q 2012: 69%
- 3Q 2009: 138%
- 1Q 2009: 11%
Average total return six months after the KBE falls -25%+ is 66%.
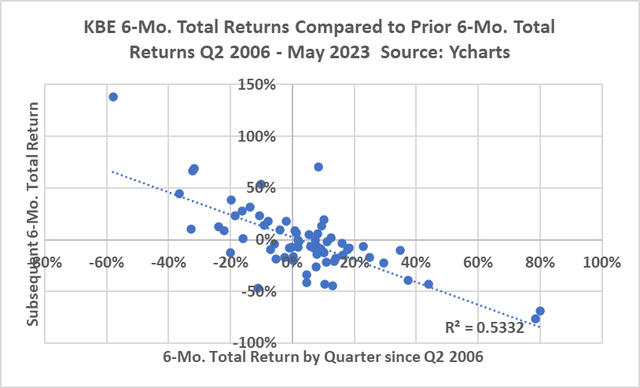
KBE 6-Mo Total Returns Comparison (YCharts)
Twelve-Month Total Returns Subsequent to a Bank Stock Plunge
On the five occasions since 2006 when KBE declined at quarter-end by at least 25%, one year later, on average, KBE showed an 83% total return. The range of total returns was a low of -1% for the year ending 2Q 2009 and a high of 138% for the year ending 1Q 2021.
Icing on the Cake: Juicy Dividends
This next chart shows what everyone knows: Bank stock dividend yields are rich after the big drop in bank stock prices during the past couple of months.
The X-axis shows current dividend yields (May 5), and the Y-axis shows the average dividend yield since Q2 2006. Symbols identified in green are investments with dividend yields today greater than the average since 2006. Red symbols are investments with dividend yields today unfavorable to history.
KBE today offer yields 1.56% (156 basis points) greater than the average since 2006. KRE today is 1.35% favorable to history.
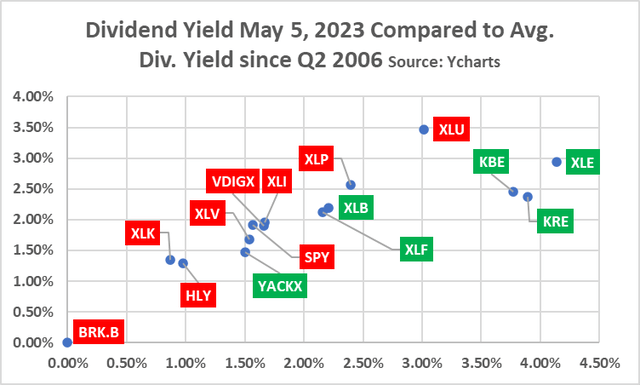
Div Yield by Investments (YCharts)
Six Risks
The ugly truth, as the data in this article show, is that the bank ETFs are not solid long-term buy-and-hold investments. Besides a long history of under-performing other sectors, KRE and KBE have a lofty .35% expense ratios.
Yet the bank ETFs could be an arrow in the speculator’s quiver.
But before rushing in to buy the bank ETFs, bear these six risks in mind:
- Too little data to make a statistically strong case for recent history to repeat itself. While the r-squares are strong, the fact is that we have less than 20 years of KRE and KBE data. Banking is a business of cycles. The good news is that I have bank data going back to 1990 that shows a similar pattern of recovery from big plunges like the industry is now experiencing. However, modern US banking goes back to the 1930s and there is a dearth of historic data about bank returns from 1930-1989. If we had better data from the ’30s and second half of the ’80s, bank investors would not see the same short-term snapback in prices seen since 2008.
- Three bank failures since March bode badly for the industry based on US banking history. Consider these facts: 9,000 bank failures during the first half of the 1930s. 3,000 failures from 1986-1991. Nearly 500 failures from 2008-2011. The point is that history shows that banks rarely fail in isolation. Failures come in bunches. There is clearly a contagion effect in bank failure. We have to go back to the mid-1970s for the last time when the number of bank failures was kept small.
- Today’s Liquidity Crisis is unlike anything the industry has experienced. There have been three times in modern banking history when there were “bank runs.” Each represented a crisis in depositor confidence. The first is the Great Depression which is well-documented. The second was the mid-1970s when a modest number of regional banks suffered from a combination of bad CRE loans and high loan-to-deposit ratios. And the third was in the late 1970s/early 1980s when the S&L industry blew up (precursor to the failure of First Republic which also held long assets funded by short liabilities). Two things are different today. First, since the mid-1980s, investors can short stocks. There is talk about banning shorts on bank stocks, but clearly shorts can influence bank stock prices. And second, and inextricably linked to shorts, is the power of social media. The failure of SVB was literally over the course of two days. The deposit insurance system has been jerry-rigged by policy makers to protect against more bank runs. But we live in a brave new world that is vulnerable to variations of recent fears that can trigger another round of bank runs.
- Credit Metrics today compare well to history. My concern is that today’s good credit numbers have been bumped up by the same liquidity factors that pumped up bank deposit levels during and immediately after Covid. US borrowers have benefited from a sugar high of liquidity that eventually will be exhausted. This concern is especially acute for commercial real estate and credit card lending, two loan types that historically struggle when the economy slows and/or interest rates rise. Offsetting credit risk worries is today’s strong employment numbers. But even this positive is at risk given the Fed’s determination to break the back of inflation.
- US Debt Ceiling worries could not come at a worse time for banks. Today some number of banks rely to some degree on the confidence of depositors in the full faith and credit of the US government. As Fed and US Treasury borrowings and contingent liabilities race daily to new highs, at some point the ability of the US government threatens its reputation as the lender of last resort. We do not know what we do not know.
- Fed and Treasury policy makers seem to be a step behind every recent turn in the economy. A year ago, we were assured that inflation was transitory. Now we are assured that inflation is so pernicious that rates must rise at the fastest pace in history. Then when rates rose, the Fed and FDIC got caught off guard by the unintended consequences of their rate decisions. Current policy makers have yet to prove their mettle.
Punchline: Bank stocks today face myriad risks not faced in the past. The factors depressing bank stock prices in 2023 are not the same as in 2020, 2008-07, 1986-91, 1974-75, the 1930s.
Closing Thoughts
I am not shunning bank stocks, just KRE and KBE.
This article has prompted two possible successor articles.
The first may compare a group of select banks as alternatives to KRE and KBE. The theory behind such an article is to construct a portfolio of banks that have the same upside potential as the bank ETFs but come with lower risk of performance drag from possible future bank failures.
The second article may focus on sector selection. Clearly investors, I included, have flocked to the lowest volatility sectors (XLP, XLU, XLV) during the past few years. As we have seen, stocks in these sectors have become more expensive. But given their volatility attributes, I am curious whether these sectors are well-worth their higher prices.
Caveat
The foregoing is my opinion. I share my investment thoughts for the purpose of getting feedback and questions that challenge my ideas and assumptions.
Every investor needs to do his/her own due diligence before investing as well as determine their risk profile. I am risk-averse, preferring to invest in the nation’s best banks which historically earn returns exceeding the cost of capital.
Read the full article here


