Introduction
Shell plc (NYSE:SHEL) is Europe’s largest oil company. The London-based Shell plc was the former Anglo-Dutch major. The company dropped its Dutch headquarters recently to become a fully British-based company.
On May 4, 2023, SHEL reported its first-quarter 2023 results.
Note: I have followed SHEL quarterly since 2017. This new article is a quarterly update of my article published on February 8, 2023.
1 – 1Q23 results snapshot
Shell plc reported first-quarter adjusted earnings per ADS of $2.78, or $9.646 billion, down 1.7% sequentially (remember, each American Depositary Share (ADS) represents two Shell plc ordinary shares).
SHEL’s revenues were $89.02 billion, up 7% compared to the same quarter a year ago.
Furthermore, SHEL announced another $4 billion in share buybacks after higher earnings and liquefied natural gas production helped compensate for lower oil and gas prices.
SHEL Quarterly liquid Price History (Fun Trading)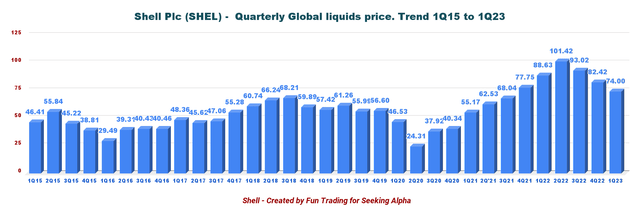
2 – Investment thesis
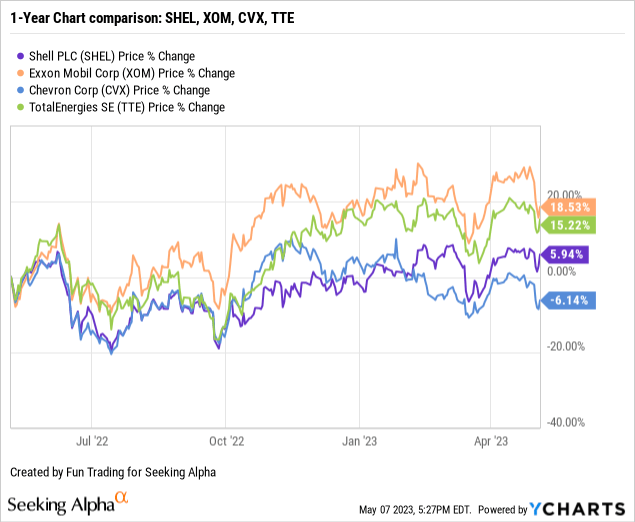
Shell plc, Exxon Mobil Corporation (XOM), Chevron Corporation (CVX), and TotalEnergies SE (TTE) are the four main supermajors that I have owned for decades.
Shell plc is one of the best long-term options to profit from the oil sector. The company is solid and presents excellent growth potential, shifting slowly away from oil to invest in green energy.
However, despite a spotless balance sheet that I will present in detail below, Shell plc cannot escape the volatility of the oil and gas industry. Investing in SHEL requires a specific trading/investing strategy to be profitable and to limit risk.
Oil and gas prices are slowly retracing from their record highs of 2022, as we can see in the chart below:
SHEL 1-Year Oil and NG (Fun Trading StockCharts)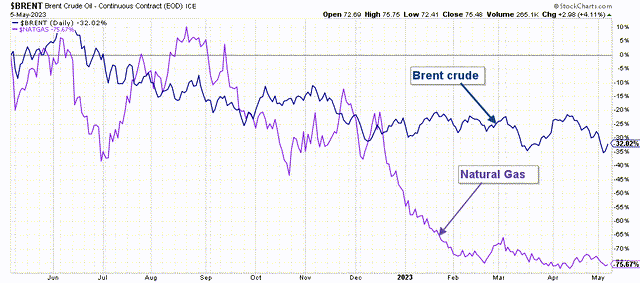
So, taking profits when SHEL is technically overbought is crucial, and I believe it is happening again.
Thus, long-term investors should continue accumulating this cyclical stock on any significant retracement but make sure to take profits when the stock looks overbought technically.
3 – Stock performance
Shell plc is up 6% on a one-year basis.
Shell plc – Financial History Table ending in 1Q23, The Raw Numbers (Per ADS)
Important Note: Each American Depositary Share (ADS) represents two Shell plc ordinary shares.
| Royal Dutch Shell | 1Q22 | 2Q22 | 3Q22 | 4Q22 | 1Q23 |
| Total Revenues in $ Billion | 84.20 | 100.06 | 95.75 | 101.30 | 86.96 |
| Total Revenues and others in $ Billion | 83.16 | 103.08 | 98.76 | 101.20 | 89.02 |
| Net income in $ Billion |
7.12 |
18.04 |
6.74 |
10.41 |
8.71 |
| EBITDA $ Billion | 18.84 | 32.46 | 17.78 | 19.23 | 21.22 |
|
EPS diluted in $/share |
1.86 | 4.80 | 1.84 | 2.92 | 2.50 |
| Cash from operating activities in $ Billion | 14.82 | 18.66 | 12.54 | 22.40 | 14.16 |
| CapEx in $ Billion | 4.24 | 6.68 | 5.27 | 6.42 | 6.16 |
| Free Cash Flow in $ Billion | 10.58 | 11.98 | 7.27 | 15.99 | 8.00 |
| Total cash $ Billion | 38.36 | 38.97 | 35.98 | 40.09 | 42.07 |
| (non-current and current) Debt in $ Billion | 79.02 | 83.74 | 81.99 | 83.80 | 85.14 |
| Dividend per share (ADS) in $/share | 0.48 | 0.50 | 0.50 | 0.575 | 0.575 |
| Shares outstanding (diluted) in Billion (ADS=1/2) | 3.83 | 3.76 | 3.67 | 3.56 | 3.49 |
| Oil Production | 1Q22 | 2Q22 | 3Q22 | 4Q22 | 1Q23 |
| Oil Equivalent Production in K Boepd (including Integrated gas) | 2,921 | 2,861 | 2,713 | 2,776 | 2,847 |
| Integrated gas K Boepd | 896 | 944 | 924 | 917 | 970 |
| Global liquid price ($/b) | 88.63 | 101.42 | 93.02 | 82.42 | 74 |
Sources: SHEL filing
Analysis: Revenues, Earnings Details, Total Debt, Free Cash Flow, And Oil & Gas Production Upstream
1 – Revenues and other income were $89.02 billion in 1Q23
SHEL Quarterly Revenue History (Fun Trading)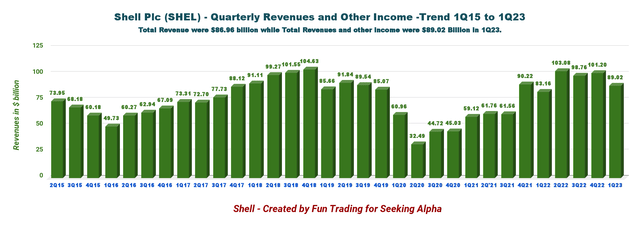
The adjusted earnings surged to $9,646 million this quarter compared to $9,814 million in 4Q22.
During the first quarter, Shell generated cash flow from operations of $14.159 billion, down slightly from $14.815 billion a year ago.
2 – Generic free cash flow was $8.0 billion in 1Q23
Note: I use cash from operating activities minus CapEx to calculate the generic free cash flow. It differs from the free cash flow indicated by Shell, which was $9.921 billion in 1Q23.
Trailing 12-month free cash flow is now $43.234 billion, with a 1Q23 free cash flow of $7.998 billion.
SHEL Quarterly Free Cash Flow History (Fun Trading)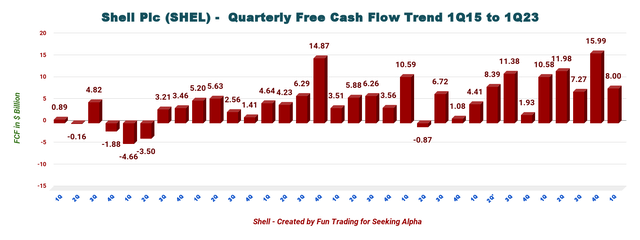
3 – Oil-equivalent production and other
SHEL Quarterly Oil equivalent Production History (Fun Trading)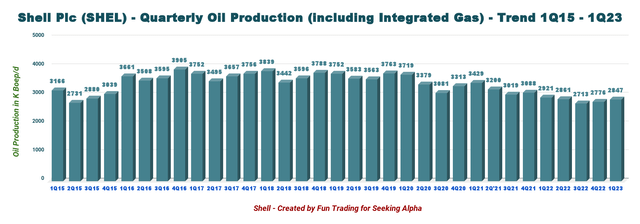
This amount doesn’t include the LNG sales volumes, which were 16.97 Million Tonnes in 1Q23, up from 16.82 million Tonnes in 4Q22.
4 – Cash vs. debt. Net debt is now $44.22 billion (Gearing 18.4%)
The net debt decreased to $44.22 billion on March 31, 2023, compared with $48.84 billion in 4Q22. It is a disappointing situation. Shell Plc should focus on cutting debt instead of using its cash to buy back its shares.
Gearing is down slightly to 18.4% (Gearing is a measure of Shell’s capital structure and is defined as net debt as a percentage of total capital).
SHEL Quarterly Cash versus Debt History (Fun Trading)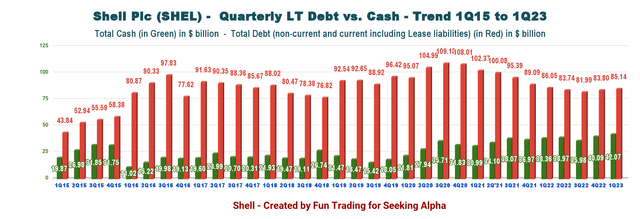
Shell should focus on cutting debt faster and eventually achieve a gearing below 10%.
5 – 2Q23 Guidance
According to the press release:
- Capital expenditure is expected to be within the $23 – $27 billion range for the entire year.
- Integrated Gas production is expected to be approximately 920K – 980K Boep/d.
- LNG liquefaction volumes are expected to be approximately 6.8 – 7.4 million tonnes.
- Upstream production is expected to be approximately 1,600K – 1,800K Boep/d.
- Marketing sales volumes are expected to be approximately 2,350K – 2,850K B/d.
- Refinery utilization is expected to be approximately 85% – 93%.
- Chemicals manufacturing plant utilization is expected to be approximately 62% – 70%, reflecting ongoing economic optimization due to the continuing low-margin environment and a slower-than-expected ramp-up of Shell Polymers Monaca.
- Corporate Adjusted Earnings are expected to be a loss of approximately $400 – $600 million in the second quarter of 2023 and a net expense of about $2,200 – $2,600 million for the full year 2023. This excludes the impact of currency exchange rate effects.
Total production is expected to be down 7% sequentially, with a mid-point of 2,650K Boep/d compared to 2,847K Boep/d in 1Q23.
Technical Analysis and Commentary
SHEL TA Chart short-term (Fun Trading StockCharts)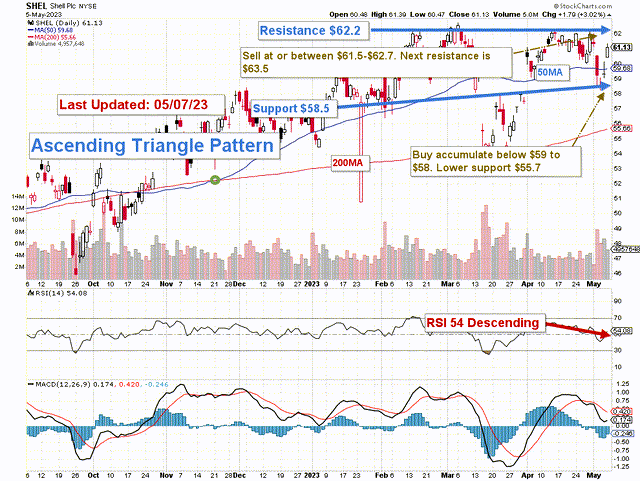
Note: The chart is adjusted for the dividend.
SHEL forms an ascending triangle pattern with solid resistance at $62.2 and support at $58.5.
The ascending triangle is a bullish continuation pattern and is characterized by a rising lower trendline and a flat upper trendline that acts as support. This pattern indicates that buyers are more aggressive than sellers as price continues to make higher lows.
The oil and gas market is cooling fast, and we have entered a new phase of uncertainty in 2023. Thus, I strongly recommend trading LIFO more regularly to exploit the wild swings we will face in 2023.
The short-term trading strategy is to trade LIFO for about 40% of your position. I suggest selling between $61.5 and $62.7 with possible higher resistance at $63.5 and waiting for a retracement between $58 and $59 to consider buying with potential lower support at $55.7.
Warning: The TA chart must be updated frequently to be relevant. It is what I am doing in my stock tracker. The chart above has a possible validity of about a week. Remember, the TA chart is a tool only to help you adopt the right strategy. It is not a way to foresee the future. No one and nothing can.
Editor’s Note: This article discusses one or more securities that do not trade on a major U.S. exchange. Please be aware of the risks associated with these stocks.
Read the full article here

