
This article was published on iREIT at Alpha on Wednesday May 3, 2023.
As I referenced in my weekend blog, I recently launched my first ETF Index known as the iREIT-MarketVector™ Quality REIT Index. It provides exposure to high-quality U.S.-listed common and preferred equity securities of real estate investment trusts, or REITs, while ensuring sector diversification.
I’m in New York City and Chicago this week meeting with fund managers and high net worth investors as I began to pitch the Index to create a listed version of the Index. Today, I met with three fund managers in which I was able to showcase the value proposition for the Index, which is essentially the blueprint for the Index.
As I explained, our Index is rooted in the same Graham-ian stock picking criteria as Ben Graham described in The Intelligent Investor:
You are neither right nor wrong because the crowd disagrees with you. You are right because the data and reasoning are right.
In other words, this REIT ETF Index is built on fundamental data that we obtain from financial statements and analyst estimates. In turn, the data is used to score constituents within the REIT coverage spectrum (the iREIT 100) and filter our the highest-quality REITs that are trading at the widest margin of safety. Back to Graham:
“…the value investor’s purpose is to capitalize upon a favorable difference between price on the one hand and indicated or appraised value on the other.
This intelligent REIT strategy is nothing new whatsoever, as this has been my stock picking blueprint for over 13 years on Seeking Alpha. By carefully selecting the highest quality dividend paying stocks I have been able to generate a sizeable portfolio that includes over 40 REITs.
Unlike other REIT ETFs that own the good, the bad, and the ugly, our REIT ETF Index is designed to own just the Good and the Great and to not overpay for them. In addition, the Index is designed to maintain responsible diversification both geographically and by sector, without too many names (di-worsification).
Today I wanted to provide you with a list of several of the “REIT Elite” that are part of our so-called “iREIT 100” universe which is the pond that the ETF Index uses to select the most promising REITs.
What sets our research platform apart from many others is the fact that we spend considerable time and resources screening for the crème de la crème because we want everyone to be part of the sleep well at night dream.
Federal Realty Investment Trust (FRT)
Federal Realty Investment Trust was founded in 1962 and is one of the oldest real estate investment trusts still operating today. FRT is a shopping center REIT that owns and develops retail-based and mixed-use properties that are located in first-ring suburbs that have densely populated areas with high-barriers to entry.
Their properties are primarily located in the Northeast and Mid-Atlantic, but their portfolio also includes properties located in California, Florida, and Illinois. FRT owns or has an ownership interest in 103 properties that include approximately 3,300 commercial tenants and around 3,000 residential units.
In total, their open air shopping centers and mixed-use properties cover roughly 26 million square feet and were 94.5% leased and 92.8% occupied as of year-end 2022.
FRT – Investor Presentation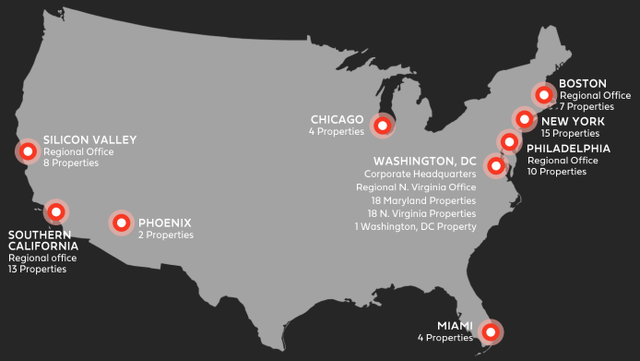
Federal Realty has the longest running dividend streak in the REIT industry as they have paid and increased their dividend for 55 consecutive years. I like the chart below because it puts the current economic environment in perspective.
Most REITs have suffered large declines over the past year in large part due to concerns over inflation and interest rates, but as seen below, FRT has operated through multiple crises and economic environments and has not suspended or cut its dividend.
A lot of focus has been put on the rate of inflation over the last year, but in 1980 inflation in the U.S. was almost 15% and FRT raised its dividend. Likewise, during the Great Financial Crisis and the covid pandemic FRT continued to raise its dividend.
FRT – Investor Presentation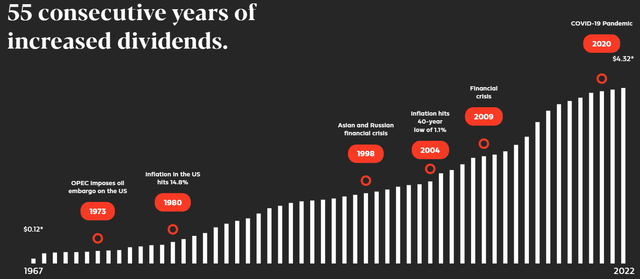
Federal Realty pays a 4.42% dividend yield but its dividend payout ratio needs to be monitored as they currently have an adjusted funds from operations (“AFFO”) payout ratio of 91.86%. While the payout ratio is high, it has been improving over the last several years, going from 123.46% in 2020, to 97.48% in 2021, to its current level of 91.86%.
Over the last 10 years FRT has an average dividend growth rate of 4.41% but dividend growth has moderated over the last 2 years with a 0.95% increase in 2021, and a 0.94% increase in 2022. The lower dividend growth rate over the last several years is likely by design to get their payout ratio to a more conservative level.
FRT has an average FFO growth rate of 3.96% since 2013 and are expected to increase FFO by 2%, 4%, and 6% in the years 2023, 2024 and 2025 respectively. The stock is trading at a P/FFO of 15.34x, which is well below their normal P/FFO of 22.96x. At iREIT, we rate Federal Realty Investment Trust a BUY.
FAST Graphs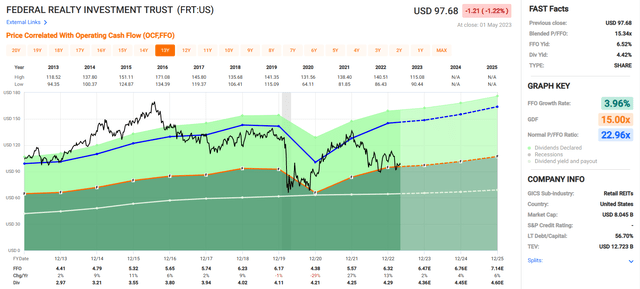
Mid-America Apartment Communities, Inc. (MAA)
Mid-America Apartment is a REIT that specializes in multifamily properties that are predominantly located in the Sunbelt region of the country. Some of MAA’s top markets are Atlanta, Dallas, Houston, Orlando, Tampa, and Charlotte.
MAA’s portfolio contains 101,986 apartment homes across 16 states and Washington D.C. MAA has an A- credit rating and excellent debt metrics.
As of their most recent update in March, MAA had a total debt to adjusted total assets ratio of 27.8%, a weighted average maturity of 7.7 years, a weighted average effective interest rate of 3.4% and a net debt to adjusted EBITDAre of 3.50x.
Plus, 100% of their debt is fixed rate and they have $1.4 billion in liquidity consisting of cash and availability under their credit facility.
MAA – Investor Presentation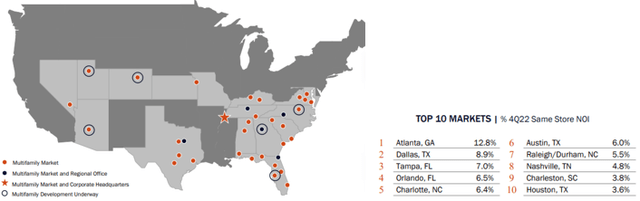
MAA has an impressive dividend track record with no suspension or cut to the dividend since 1994. They currently pay a 3.62% dividend yield that is very secure with an AFFO payout ratio of 60.95%. Along with the consistency of their distributions, they also have a notable average dividend growth rate of 5.92% over the last 10 years.
MAA – Investor Presentation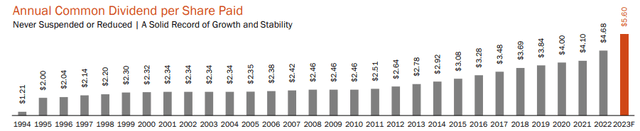
MAA reported their first quarter results on April 26, 2023. Q1 2023 FFO was reported at $2.21 per share which represents a 12.14% increase from the first quarter of 2022 and Core FFO (“CFFO”) came in at $2.28 per share vs $1.97 per share in the same period last year for a 15.74% increase. First quarter revenue increased 11% and net operating income (“NOI”) increased 12.5% when compared to the first quarter in 2022.
MAA disclosed in their earnings release that they have 6 communities under development which will add around 2,310 additional units once completed and that they completed the redevelopment of 1,328 units as of the end of the first quarter.
MAA is a high-quality REIT that currently trades for a P/FFO of 18.14x which is a slight premium to their normal P/FFO of 17.20x. At iREIT, we rate Mid-America Apartment Communities a BUY.
FAST Graphs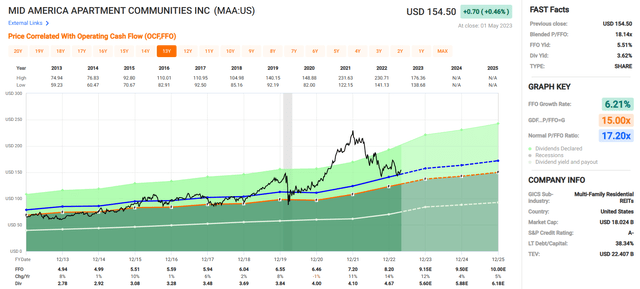
NNN REIT, Inc (NNN)
NNN REIT, Inc, formerly National Retail Properties, is a net-lease REIT that owns and develops properties that are leased to retail tenants on a triple-net basis. NNN’s portfolio consists of 3,411 properties that are located in 48 states and cover a gross leasable area of approximately 35 million square feet.
Their portfolio’s weighted average lease term (“WALT”) is 10.4 years and roughly 99% of their properties were leased as of the end of 2022.
NNN has over 400 tenants that operate in over 30 different lines of trade. As a percentage of their annual base rent (“ABR”), their largest line of trade is convenience stores (16.5% ABR), followed by Automotive services (13.7% ABR). NNN’s top 5 States by number of properties are Texas (528), Florida (257), Ohio (192), Georgia (167) and Illinois (164).
NNN – Investor Presentation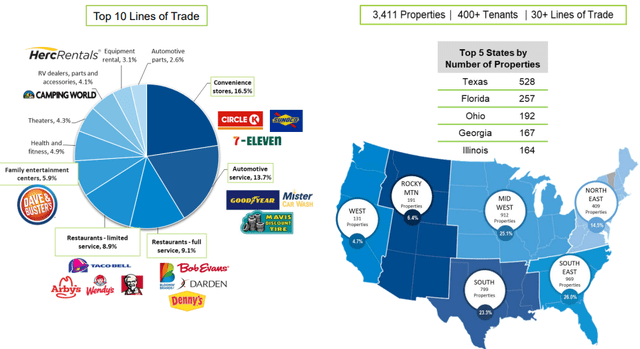
NNN pays a 5.09% dividend yield and has an excellent dividend track record with 33 consecutive annual increases. The dividend is very well covered with an AFFO payout ratio of 67.29% and over the last 10 years NNN has an average dividend growth rate of 3.31%.
NNN – Investor Presentation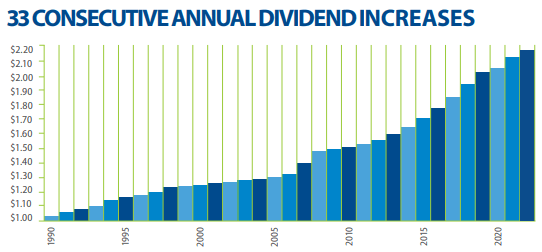
NNN REIT, Inc released their first quarter earnings results on May 2, 2023. Revenue for the first quarter came in at $204.1 million vs $190.3 million in the first quarter last year.
FFO was reported at $0.80 per share compared to $0.75 per share in the first quarter of 2022, representing a 6.7% increase, and Core FFO increased by 3.9% with $0.80 per share generated in Q1 2023 vs $0.77 per share in Q1 2022. First quarter AFFO per share totaled $0.82 which was a 3.8% increase over the prior years first quarter AFFO of $0.79 per share.
Additionally, NNN announced that 43 properties had been acquired with a total gross leasable area of around 275,000 square feet at an initial cash cap rate of 7.0%, and 6 properties were sold at a cap rate of 6.6% during the first quarter of 2023.
Since 2013, NNN has increased its FFO per share every year except during the pandemic in 2020. The average FFO growth rate over this period is 5.20% and analysts expect FFO growth of 2% in 2023 and 4% in 2024. NNN trades at a P/FFO of 13.70x, which is well under its normal P/FFO of 17.53x. At iREIT, we rate National Retail Properties a BUY.
FAST Graphs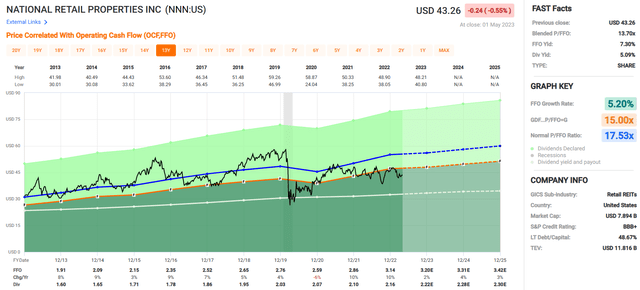
W. P. Carey Inc. (WPC)
W. P. Carey Inc. is a net-lease REIT that was founded in 1972. They specialize in single-tenant properties that include industrial / warehouse, office, and retail. Their portfolio has 1,446 properties that serve 397 tenants in 26 countries and covers approximately 176 million square feet.
Their net lease properties have a 99.2% occupancy rate and a weighted average lease term of 10.9 years. WPC primarily invest in net-lease single-tenant properties but also has a portfolio of 84 self-storage properties that contain 52,093 units with an average occupancy rate of 91.5%.
By property type, WPC has a diversified asset mix with 51% of their ABR coming from Industrial / Warehouse properties, 17% coming from retail properties and 17% coming from office properties.
WPC – Investor Presentation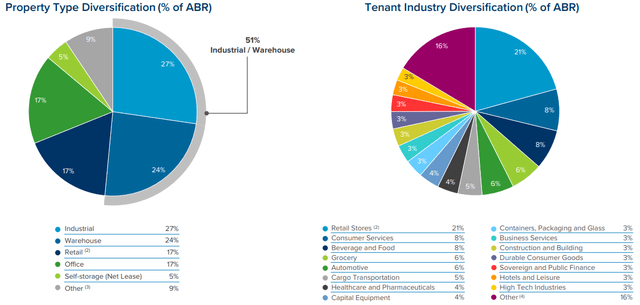
WPC pays a 5.78% dividend yield that is well covered with an AFFO payout ratio of 80.19%. Over the past 10 years they have an average dividend growth rate of 6.29% and have increased the dividend every year since going public in 1998. Their most recent increase was in the first quarter of 2023 when they increased the dividend from $1.065 to $1.067 per share.
WPC – Investor Presentation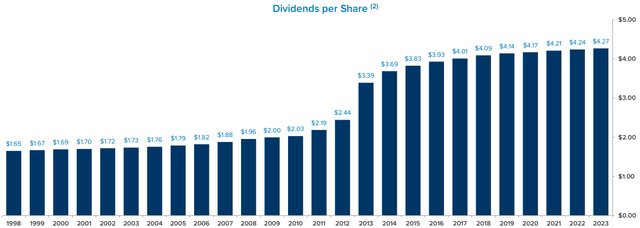
WP Carey released its first quarter earnings on April 28, 2023. FFO came in at $1.29 per diluted share, down from $1.50 per share in the first quarter of 2022. AFFO was reported at $1.31 per diluted share vs $1.35 per share in same period last year.
Updates on investment activity were provided as well with investments in the first quarter totaling $177.8 million and investments subsequent to the end of the first quarter totaling $565.7 million. WPC maintained its initial guidance with an AFFO midpoint of $5.35 and investment volume for the full year ranging between $1.75 billion and $2.25 billion.
WPC has a BBB+ credit rating and solid debt metrics with a pro rata net debt to adjusted EBITDA of 5.8x, a total consolidated debt to gross assets ratio of 40.3%, and a fixed charge coverage ratio of 5.4x. Their debt has a weighted average interest rate of 3.1% and a weighted average term to maturity of 4.1 years.
Since 2013 WPC has had an average FFO growth rate of 6.58%. Analysts expect FFO to fall by -5% in 2023 before returning to growth with estimates of 5% and 3% FFO growth in the years 2024 and 2025 respectively. WPC trades at a P/FFO multiple of 13.62x which compares favorably to its normal P/FFO of 15.81x. At iREIT, we rate WP Carey a BUY.
FAST Graphs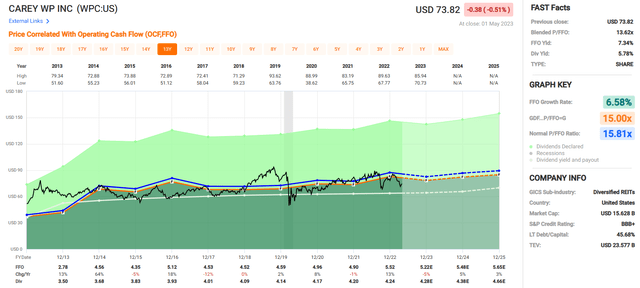
Did I Leave One Out?
I know you’re probably wondering, why didn’t I include Realty Income Corporation (O) in this article?
Don’t worry… it’s coming. I wanted to provide a detailed overview of the latest earnings call and debunk a few myths.
Stay tuned.
As always, I look forward to your comments, questions, or criticisms. I’m here to help.
Happy SWAN Investing!
An investment operation is one which, upon thorough analysis, promises safety of principal and satisfactory return. Operations not meeting these requirements are speculative.” Ben Graham.
Read the full article here

