Introduction
In this article, I’m going to be running Sofi Technologies (NASDAQ:SOFI) through the 10-bagger rating list. Sofi’s CEO, Anthony Noto, recently wrote the following on the platform X:
“When I joined the Sofi …in Feb 2018, “every” fintech company said they wanted to be a one-stop shop. Now, 5.5 years later, only Sofi has done it…[even] the industry incumbents still haven’t been able to put all of their products on a digital platform and become a one-stop shop.”
Does this leading neo-bank have the potential to give investors a 10x return? If you enjoy this analysis or are interested in the following companies then check out how they fared on the 10-bagger rating list:
The 10-Bagger Rating List
Check out the start of this series in “The Hunt For Potential 10x Returns: 2 Software Giants” where I have calculated the required annualized return to gain 10x returns over different time horizons. The power and influence 10x returns can have on your portfolio is immense, and I believe there are certain factors that correlate with this outcome. In short, this is what the series is all about:
In this series, I will be rating one/two companies based on pre-determined criteria which have been found to increase the chance of a stock becoming a 10-bagger. My goal in this series is hence to give investors a quick checklist of 10-bagger factors for a multitude of different companies to compare with over time. Furthermore, I will be cumulatively adding to a scatterplot each company’s 10-bagger rating and Seeking Alpha Quant rating which we can track over time.
With inspiration from Christopher Mayer and Peter Lynch, as well as my own experience with investing, I have created the following rating list, which ranges from 1-10, with what I believe are the most important factors that contribute to a potential 10-bagger status.
Rating List
- Profitability (“ROIC”), (“ROE”) or (“ROCE”)
- Insider Ownership
- Share Repurchases
- Gross Profit Margin
- Intangibles.
Profitability: Ex. Returns on Invested Capital (“ROIC”), Return on Equity (“ROE”), Return on Capital Employed (“ROCE”).
| Rating | Level |
| 1-2 | <(0)-2% |
| 3-4 | 3-6% |
| 5-6 | 7-9% |
| 7-8 | 10-15% |
| 9-10 | 15%+ |
Insider Ownership
| Rating | Level |
| 1-2 | 0-5% |
| 3-4 | 5-10% |
| 5-6 | 10-25% |
| 7-8 |
25-50% |
| 9-10 |
50%+ |
Share Repurchase (yearly % purchase of outstanding shares)
| Rating | Level |
| 1-2 | <(-5%) |
| 3-4 | (-5)-(0%) |
| 5-6 | ±0% |
| 7-8 | 1-5% |
| 9-10 | 5%+ |
Gross Profit Margin
| Rating | Level |
| 1-2 | Compressing |
| 3-6 | Steady |
| 7-10 | Expanding |
Intangibles
| Rating | Intangible Asset |
| 1-10 | Company Culture |
| 1-10 | Industry Potential |
| 1-10 | Operating Leverage |
Sofi Technologies: $9 billion Market Cap
($90 billion for 10-bagger status)
| Characteristic | Level | Rating |
| Returns on Invested Capital (“ROIC”) | 0,04% | 1 |
| Insider Ownership | 2,7% | 2 |
| Share Repurchases | (9,25%) | 2 |
| Contribution Margin | Greatly Expanding | 10 |
| Intangibles | Exceptional | 8,7 |
Total Points: 23,7/50
Returns on Invested Capital (“ROIC”)
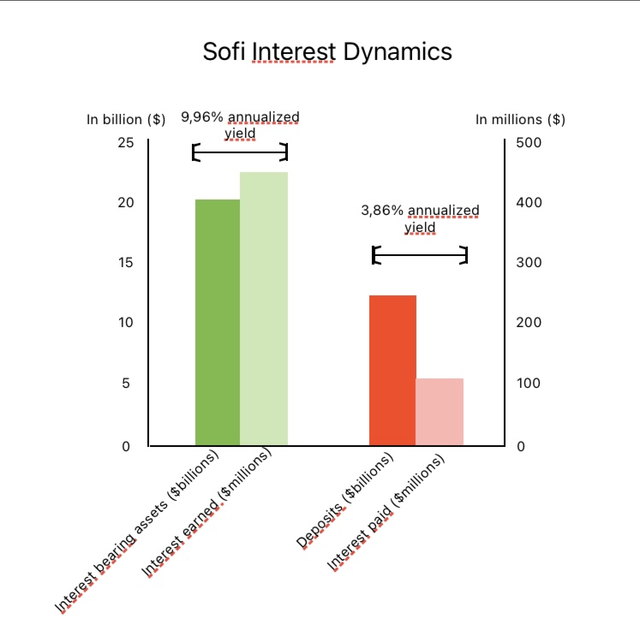
Sofi’s, as a neo-bank, operates chiefly by originating loans. Other than this, the company offers a credit card product, an investment platform, insurance, as well as travel benefit offerings. Given the fact that consumers use Sofi similarly to a regular bank, the liability side of its balance sheet consists of $12 billion in consumer deposits earning 3,86% in average interest. Furthermore, the company finances its operations with about $6,4 billion of debt of which half is comprised of a warehouse facility arrangement carrying an average of 6,02% interest, $900 million in securitized debt (carrying 4,76% interest), and 1,6 billion in “other debt” which carries an annualized interest of 3,29%.
On the asset side, Sofi has around $18,2 billion worth of loans held for sale (with an average interest yield of 9,96%), $1,6 billion in goodwill, as well as a smaller portion of intangible assets and capitalized software development. Hence, the interest that Sofi earns on its loans covers the interest it needs to pay depositors. In the latest quarter, Sofi earned $402 million in interest on loans while it paid $106 million to depositors.
(All information found: Sofi Q2 Earnings Release)
The Author
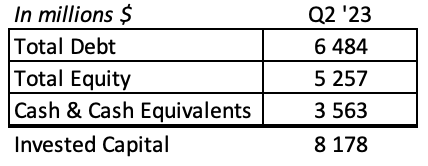
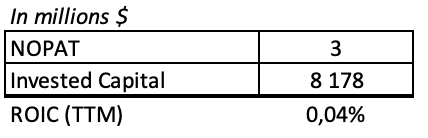
In sum, the company has an invested capital of $8,1 billion when excluding its restricted cash position of ~$400 million.
The Author
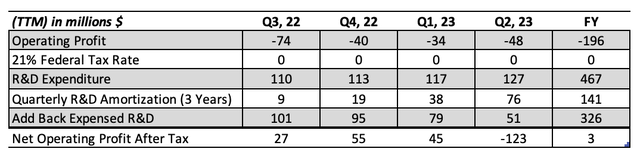
For the sake of this calculation, and in line with my previous articles, I will use twelve trailing months figures and I will adjust “NOPAT” by capitalizing R&D costs for an assumed 3 years. Sofi spent 25,3% of revenue on product development, which is slightly above the consumer-facing finance company Block Inc – spending 22,1% of revenue on product development. When adding back the expensed “R&D”, I find that Sofi was profitable from (Q3,22-Q1,23) but not in Q2,23 due to the cumulative amortization. Overall, for the full year “TTM”, the company is slightly profitable with $3 million in “NOPAT”.
The Author
When dividing “NOPAT” by invested capital, I find that Sofi has a “ROIC” of 0,04%. This places the company on the lowest end of the 10-bagger scale, which earns it a 1/10 in profitability. Although Sofi’s profitability is not very high as of current, Noto has guided for profitability in Q4 of this year:
“We remain well on track for GAAP profitability by Q4. And a few trends stand out in support of this anticipated achievement.”
(Seeking Alpha Transcripts)
He cites that the company’s lending business is already contributing to positive income, adjusted EBITDA was $77 million which exceeded stock-based compensation of $76 million, and the loss on the Financial Services business shrank to just $4 million. Sofi is investing heavily in its technology platform and ongoing sales and marketing expenditures to drive customer adoption. Even though these expenditures are contributing to the negative net income for the company, they are necessary for Sofi to create a ‘one-stop shop’ with mass user adoption. As the years pass, I expect Sofi to leverage these investments and receive higher returns on invested capital.
The Author
Insider Ownership
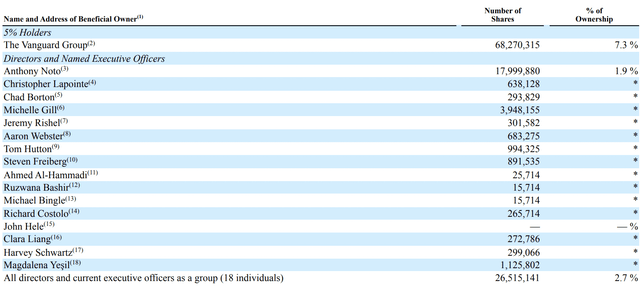
Sofi has a generally low level of insider ownership. Based on the latest proxy filing, insider ownership amounted to 2,7% of all outstanding shares. This equates to 26,5 million shares with a current market value of $251,75 million.
Sofi Proxy Filing
Anthony Noto, the CEO, has the largest amount of outstanding shares valued at $171 million – a hefty compensation. Anthony has extensive experience as a business leader, but he was not the founder. Sofi was founded by four college graduates from Stanford in 2011 with the goal of providing more affordable student loans (Sofi Background). After the co-founders jumped off at varying times before and after 2017, Anthony Noto took the position of CEO in 2018. Before Sofi, Anthony served as COO of Twitter, CFO of the national football league, and partner at Goldman Sachs (Sofi Leadership). Although the company’s insiders have all departed, they paved the way for Sofi to succeed going forward. In 2017, co-founder, Dan Macklin wrote:
“First of all, I would say it’s been a very difficult decision… To step away from SoFi — it’s a hard decision. I feel comfortable making that decision now given the shape we’re in… The company is in really great shape, so for me it feels like the right time to make the switch.”
(Tech Crunch)
Since then, Noto has been leading the company successfully and has done so with what seems like an insider mindset. Nevertheless, based on the 10-bagger criteria, I rate Sofi a 2/10 with regard to insider ownership.
Share Repurchases
Based on Ycharts data, Sofi has increased its outstanding shares from around 800 million in Jul ’21 to 948 million as of Aug’ 23. This equates to a total dilution of 18,5% or 9,25% annually. According to the company’s Q1 ’22 filing, Sofi issued around 88,7 million shares in order to purchase Technisys S.A. (Q1 ’22 Report). This is the reason for the large jump in shares seen below. Technisys is “a cloud-native digital and core banking platform with an existing footprint of financial services customers in Latin America.” Noto describes the acquisition as a strategic vertical integration in the Q1 ’22 earnings call.
“Our March acquisition of Technisys further differentiates our technology platform by allowing us to incorporate a next-generation multiproduct core banking technology into our lending and financial services platforms and it enhances our value proposition for Galileo clients. This type of vertical integration enables faster innovation and growth as well as greater operating efficiencies.
Technisys also brings a complementary footprint of established banks, digital banks and fintechs in Latin America, adding to the robust growth opportunity of Galileo’s existing presence in Mexico and Colombia. Galileo and Technisys are already going to market together to offer new products and services to the Galileo clients looking to expand their lineup. Early reception among existing Galileo and Technisys clients in the U.S. and LatAm has been very positive”

As a result of the recent acquisition, Sofi has diluted shareholders by about 9,25% per year for the past two years. This amount of dilution, although potentially well-warranted, is what motivates me to rate the firm with a 2/10 with regard to share repurchases. One detail that I enjoy looking at when companies acquire others is the amount of goodwill they receive. In a paper I co-authored, “Does Purchased Goodwill Create Shareholder Value?”, we found that a higher percentage of goodwill at the time of acquisition in aggregate destroys shareholder value. In this case, Sofi’s purchased goodwill percentage for Technysis amounted to 77%, which is well above the average of 50% in our dataset of ~750 samples.
Contribution Profit Margins
For every other company in the series, I have analyzed the latest five-year trend in gross margins. Interestingly, Sofi does not report “COGS” and hence a gross margin. Rather, the company reports contribution margin for each business of the following business units: Lending, Technology Platform, and Financial Services. The contribution margin equals the Adjusted Net Revenue minus the directly attributable costs spend to generate the revenue. Using the company’s earnings presentation disclosures, I have consolidated the total contribution and contribution margin for each of the business units over five years’ time.
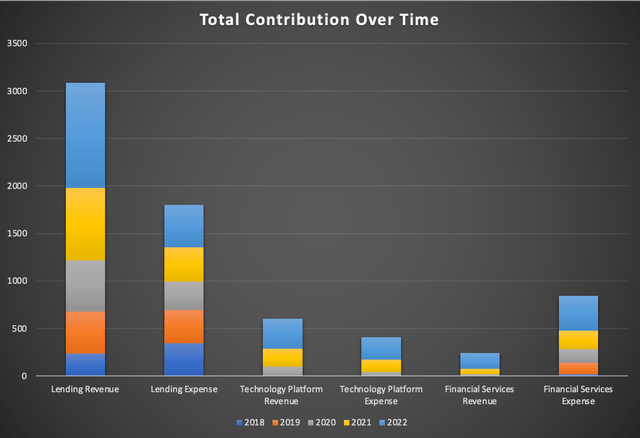
Total Contribution
Lending has contributed to over $3 billion in adjusted revenue over the past five years while costing around $1,8 billion. As you will see more clearly below Lending was not a net contribution contributor in 2018, but the business has scaled its margins immensely over time. Next is the Tech Platform which has earned a cumulative $605 million in adjusted revenue and $411 in cumulative costs. In 2018 and 2019, this business earned less than $1 million in revenue. With the acquisition of Galileo, adjusted revenue increased to $96 million in 2020 and $194 million in 2021. Finally, Sofi’s financial services segment is bleeding with expenses. Sofi has been investing heavily in this segment but has as of yet not received any net contribution from it. Despite this, the segment’s margins are increasing exponentially as we will see below.
The Author
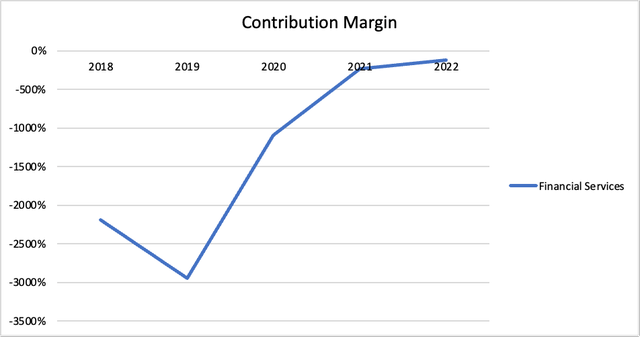
Contribution Margins
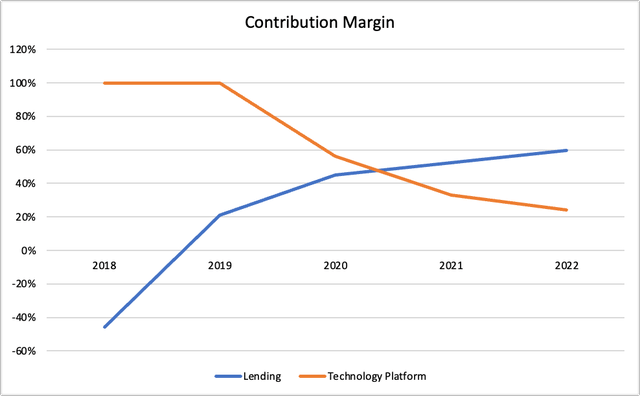
Lending margins have grown incredibly from -46% to 60% over the past five years. The Technology Platform, on the other hand, is experiencing an inverse trend. As you will notice, this segment had 100% margins in 2018 & 2019. This is what is stated in the company’s report, but as I mentioned earlier the adjusted revenue during this time was under $1 million. It is best to compare this segment starting in 2020 when Sofi acquired the tech platform Galileo and later Technysis. From 2020 to 2022, the Tech Platform’s margins have decreased from 56% to 24%. One reason for this is that Galileo has overall higher margins than Technysis, so with the acquisition in 2022 margins were pulled downwards. For example in Q1 ’23, the Tech Platform’s contribution margin including and excluding Technysis was 28% and 19%. Another reason for the declining margin is as the CEO stated:
“Sequentially, revenue and contribution profit declined in [for the Tech Platform] due to seasonality in transaction volumes, along with timing implications from shifting focus to larger potential partners with larger existing businesses, B2B customers and a more durable customer base which has longer sales cycles.”
(Seeking Alpha Earnings Transcripts)
When moving from acquisition to scaling a platform it is natural to sacrifice margins for longer-lasting, larger customers.
The Author
Separately, I have included the contribution margin for the financial services segment separately because it has a completely different scale compared to the other segments. In its trough during 2019, Sofi was spending 30x more on Financial Services than it was earning. In 2022, that same ratio is 2,2x. This segment has hence been able to drive leverage from earlier investments.
The Author
Sofi clearly has a history of investing heavily and then earning outsized profits in the future. For the lending and tech platform business, these investments have already paid off. Furthermore, the financial services segment is close to delivering a positive contribution margin. Due to this performance, I rate the company a 10/10 with regard to contribution margin.
Intangibles
| Intangible Asset | Rating |
| Company Culture | 9 |
| Industry Growth Rate | 10 |
| Operating Leverage | 7 |
Average Points: 8.7
1. Company Culture
Based on 809 ratings on Comparably, Sofi scored an overall 4,5/5 rating and Anthony Noto scored 82/100, which is the top 5th percentile of CEOs. One review stated the following about management:
“I like best about the leadership team that they run after problems. Nothing is too big or too small for leadership to take accountabilty for and they’re always open to suggestions and constantly improving.”
Other than management being ambitious and responsible, they also seem to give employees autonomy in their roles. This means that employees are expected to work at a fast pace and meet KPIs to grow within the firm. One employee noted that this could sometimes lead to a stressful work environment that left some employees burned out.
One thing that stands out to me in comparison to other corporates is Sofi’s core values (Sofi Values). The values listed are far from generic. The first, most important, value for this consumer-facing neo-bank is “put our members’ interests first” – a key mantra for gaining customer loyalty. Other core values are centered around selflessness and results – “Make your footprint bigger than your foot”, “Do the right thing. If you’re not sure, do the harder thing”. These values guide employees to take on hard projects without boasting about them. To me, these values promote collaboration and playfulness; the final value is the cherry on top “…and don’t forget to smile”.
High approval ratings, and strong values, weighed down by a potential burnout culture motivate me to give the company a 9/10 with regard to company culture.
2. Industry Growth Rate
The consensus revenue estimates for Sofi imply that the company will grow its revenues into year-end 2027 with a “CAGR” of 22,9%. This may be considered reasonable considering the company’s “CAGR” of 41,3% between 2018 and 2022. In order to better gauge whether these estimates are reasonable, we should look into the projected growth rate of varying loan volumes.
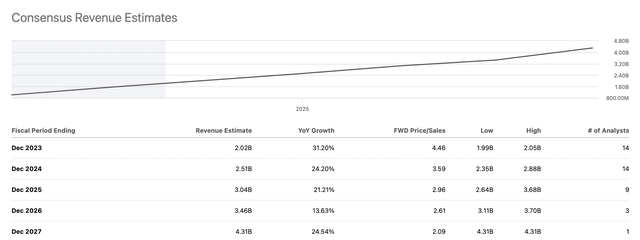
Seeking Alpha
Overview
Out of all consumer debt in the United States, the vast majority is made up of mortgage loans. Student and auto loans follow, making up around 9% each. Finally credit card, other, and personal loans make up the last 8,9% of consumer debt. Sofi operates within all of these segments and as shown above, the lending business is the company’s largest.
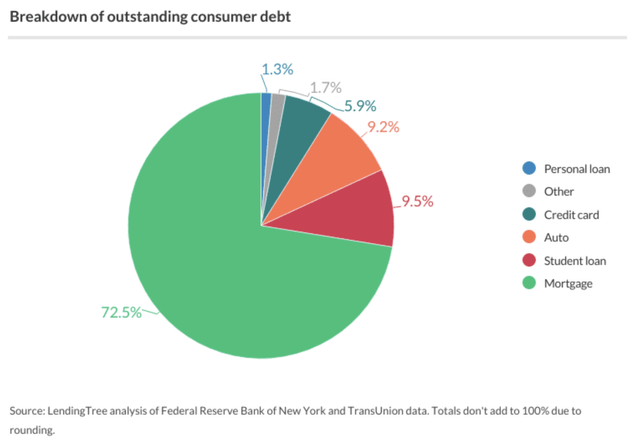
Lending Tree & New York Fed
Consumer Debt Projection
In order to simplify the projected growth rate of consumer debt, I will set aggregate household debt equivalent to consumer debt since it includes all of the above-mentioned debt categories (Household Debt Definition). This method is subject to much less error than gathering projections for each debt category on its own and then aggregating them.
With that said, we know that household debt as a percentage of GDP has fluctuated between 74-82% over the past ten years (Trading Economics). If we assume the GDP growth rate to be around 2% over time, then we can make a relatively accurate prediction of different outcomes in total household debt over time.
Currently, household debt to GDP is around 74,4 percent – the lowest level since 2002. The reason why household debt has been diminishing is because there was a great wealth transfer that happened during the pandemic. As central banks printed money for consumers and bought debt (in the form of treasuries), wealth was transferred from the state to corporations and households. Ray Dalio explains this so well here. Since households and corporations are still wealthy, household-to-GDP levels are likely to stay relatively low. Trading Economics is, for example, projecting these levels to be at 73% in 2023 and 74% in 2024. Let’s look into a projection below.
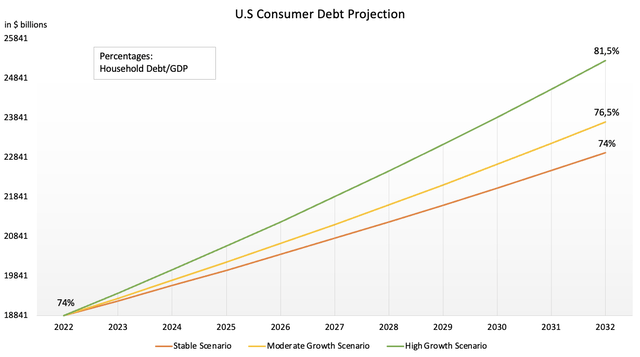
The Author
I have graphed three projections that all assume 2% GDP growth off of the $25 462 billion in 2022 (Trade Economics). The stable scenario assumes a constant 74% household debt/GDP ratio, the moderate growth scenario assumes 0,25% yearly growth of the ratio, and the high growth scenario assumes 0,75% yearly growth of the ratio. Intuitively, in the base case, absolute indebtedness will grow 2% annually almost $23 000 billion. In the moderate case the “CAGR” will be 2,3% and in the high growth case the “CAGR” will almost reach 3%. The growth in household debt will naturally increase loan volumes facilitated by Sofi and provide a natural tailwind for the company.
To be clear, I believe that Sofi’s loan origination volume will grow much faster than this aggregated projection. This is due to the company being able to take market share in a slightly growing market. Based on these projections, there will be between a $4-6,5 trillion increase in consumer debt over the next 10 years. This means that Sofi, with $18,2 billion in loans held for sale, has a huge market potential. The strong potential that Sofi has in its largest segment coupled with strong growth in its tech platform are what motivate me to give the company a 10/10 rating with regard to industry growth.
3. Operating Leverage
As I discussed earlier in the contribution margin section, Sofi has a history of driving leverage within its businesses. However, this doesn’t hasn’t been reflected in the company’s operating income. Over the past five years, operating expenses have grown in tandem with revenue.
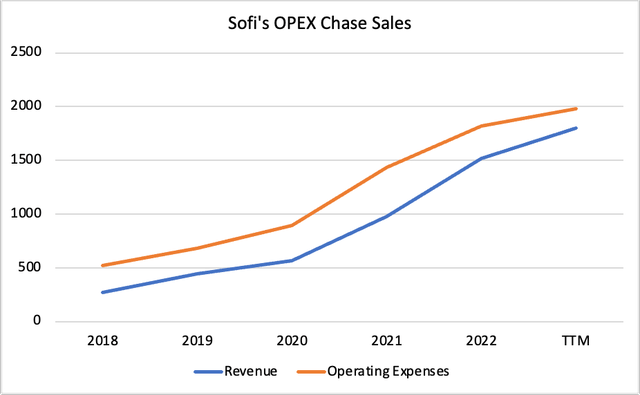
The Author
In fact, it hasn’t been until the twelve trailing months (“TTM”) that revenue has begun to close in on “OPEX”. Sofi has needed heavy investment in order to grow its customer base, which now stands at 6,2 million. Therefore, it is not a poor indicator that Sofi hasn’t driven operating leverage in the past. What matters is what is to come.
Since Sofi has all of its products – loans, checking accounts, investing, credit cards, and credit score monitoring – on one platform, the company derives a marketing advantage when it brings in a customer to one product. Over time, it is likely for the member who went to Sofi in order to refinance a loan to begin using the checking account and then the investment platform, and so on. This means that Sofi has some operating leverage built into the business model, which implies that it will be able to slow down marketing expenditures as a percentage of revenue over time. The company calls this strategy the Financial Services Productivity Loop.
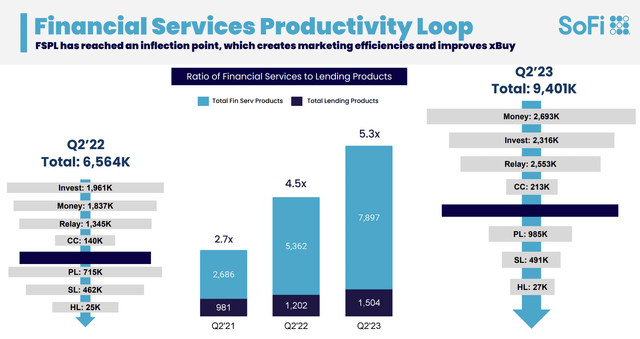
Sofi Q2 2023, Presentation
Sofi measures its business in the form of products, which are basically the cumulative amount of accounts that users have set up over time. For example, by Q2, Sofi accumulated 2,69 million money products which means that 2,69 million people have signed up for a checking or savings account. In total, Sofi members have used a cumulative total of 9,4 million products which represents 1,5 products per member. As members opt into new products, Sofi will be able to achieve greater monetization per member over time.
In relation to Sofi’s main lending business, the financial services business has grown dramatically from a product ratio of 2,7x in 2021 to a ratio of 5,3x in 2023. This reflects the company’s successful positioning as a one-stop shop in consumer finance. Although I am optimistic about this trend continuing, I am less optimistic about Sofi’s ability to monetize the Financial Services segment. As I displayed above, Sofi’s financial services business has had steeply negative contribution margins, which have neutralized over time. Still, I don’t expect for example Sofi Invest or Sofi Relay to contribute a significant amount of contribution in the long run. Financial services that I do believe can contribute, but do not yet have a clear path forward, are referred loans and credit cards. If Sofi can get its users spending through its credit cards and attain referral fees for loans it doesn’t want to hold on its balance sheet, then I really believe Sofi will get a flywheel going. As of yet, member adoption rates are not high enough, but since the concept has great potential I rate the company with a 7/10 with regard to operating leverage.
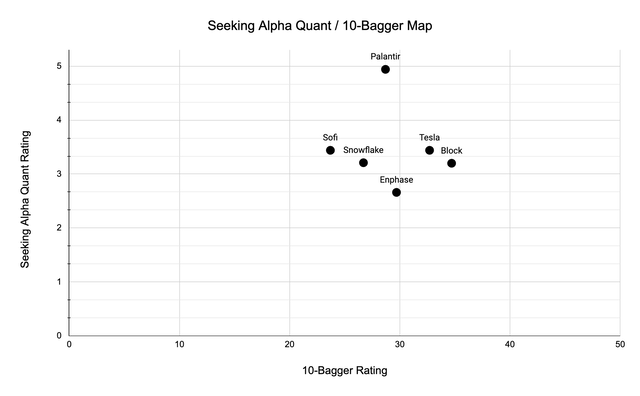
10-Bagger Rating & Seeking Alpha Quant Map
What follows now is a map continuously plotting the companies I analyze based on my 10-bagger rating and Seeking Alpha’s quant rating. This allows us to gauge different companies’ performance over time.
Sofi Technologies Quant Rating: 3,44/5,00
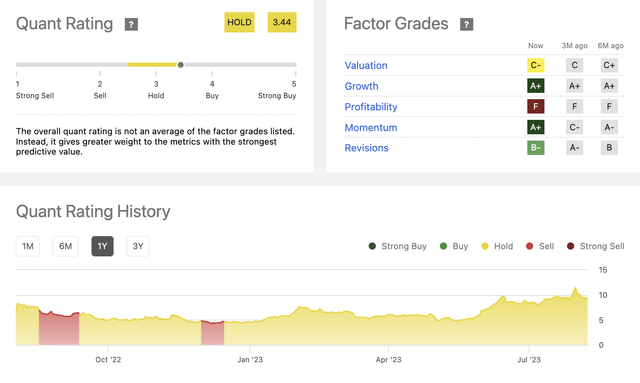
Seeking Alpha
Rating Map
In this analysis, I find that Block scores a record 23,7/50 on the 10-bagger scale and a 3,44/5,00 with Seeking Alpha’s quant rating. Seeking Alpha acknowledges Sofi’s incredible growth as I have also pointed out. Furthermore, the quant rating and I agree with the fact that profitability has been a problem for a long while. This is set to turn already in Q4 this year and further operating leverage will be drawn from the Financial Services Loop. Sofi scores the lowest so far on the 10-bagger list due to its weak profitability, share dilution, and low insider ownership. However in order to holistically view the company we need to look into the valuation below.
The Author
Valuation
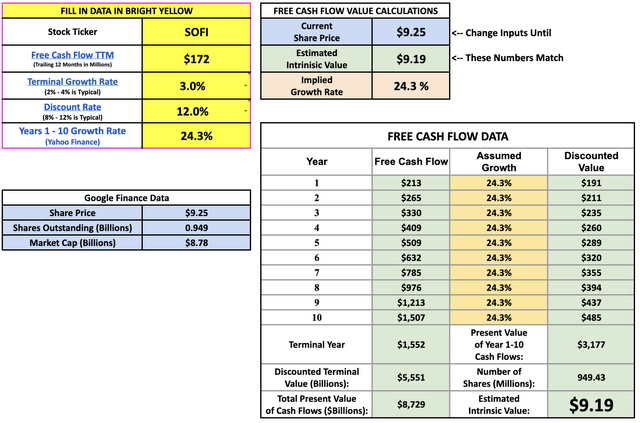
As opposed to the other companies that I have evaluated, Sofi does not have ordinary cash flow dynamics. Namely, since Sofi’s main business is lending its cash flow from operations needs to be adjusted by the changes in loans held for sale. In the latest quarter, Sofi increased its loans held for sale by $2 billion which is represented as a negative cash item in the cash flow statement. Hence I have decided to use Sofi’s Adjusted EBITDA as a proxy for operating cash flow, which the company has disclosed in the investor presentation (Investor Presentation Q2). During the “TTM”, Sofi delivered an Adjusted EBITDA of $265 million. During the same period, Sofi incurred capital expenditures of $93,2 million. This leads me to a “TTM” free cash flow proxy of $171,8 million.
Brian Feroldi/Stoffel/Withers
In order to justify its current valuation, Sofi needs to grow its free cash flow proxy (Adjusted EBITDA – “CAPEX”) by 24,3% per year over the next ten years. I believe this is doable given the long runway for growth that the company has. Another way to think about it is that Sofi could grow cash flows by ~12% for the next 20 years – does that seem reasonable? In the most recent quarter, Sofi disclosed that it expects to achieve $343 million in Adjusted EBITDA (on the high end) for 2023, which represents 340% growth compared to 2022. The scaling of Sofi and the shift toward profitability make me believe that the current valuation is in line or even low compared to long-term expectations.
Sofi is the lowest-rated company on the 10-bagger list yet, scoring 23,7/50 which motivates me to rate the company a hold for the time being. It is important to mention that this score is by no means a proxy for Sofi’s future performance, rather it is a reflection of the company’s performance within the set of confines that could explain multi-bagger returns. Nevertheless, I hope you enjoyed the article and drop your comments/discussions about the company below!
Read the full article here

