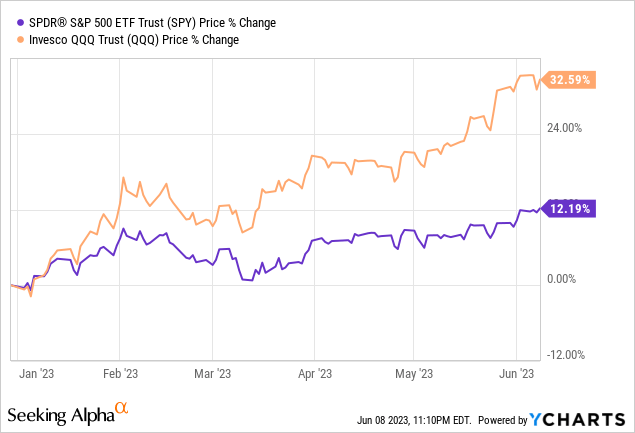
The SPDR S&P 500 Trust (NYSEARCA:SPY) has had a great year so far, rising more than 12% YTD. However, we think much of this new optimism may be based on fundamental and economic indicators going in the wrong direction, as we think the index is long overdue for a correction.
We currently see a contagion of banking problems, a looming credit crunch, overly tight monetary policy by the Federal Reserve combined with a lag in monetary policy and labor market indicators. Therefore, we address why we think the S&P 500 could easily return to October 2022 lows very soon, while economic conditions and earnings continue to deteriorate toward the end of this year.
Still Inverted
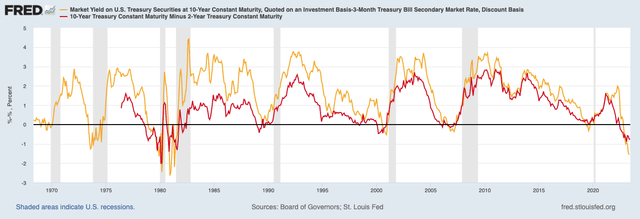
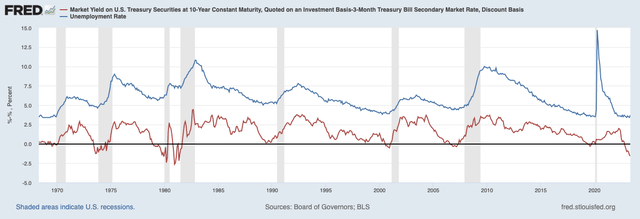
The first item on the agenda and the reason we are very cautious in this market has to do with the curvature of the yield curve. Both the 3-month 10-year spread and the 2-year 10-year spread are deeply inverted, the most since the 1980s.
We focus mainly on the 3-month to 10-year spread, which is currently 165 bp inverted. In recent history, an inversion of this magnitude has always caused a severe recession, with the median time for the onset of a recession being about 12 months after the inversion. For context, the 3-month to 10-year spread inverted around last October and the current inversion has lasted about eight months.
Federal Reserve (FRED)
However, the longest time until a recession began after an inversion was about 17 months in 2008, which means we expect a recession to begin sometime between now and March of next year. If we assume the 12-month average, the recession is likely to begin around October of this year.
However, it is important to note that this inversion in the yield curve is not just a signal of investors’ risk-averse sentiment about future expectations for both growth and inflation. Investors may expect lower interest rates soon, but it also has major implications for credit markets, such as banks that have the business model of borrowing at short-term rates and lending at long-term rates. The failure of several banks in recent months, combined with the deposit flight we will talk about in a moment, has not made this situation any easier.
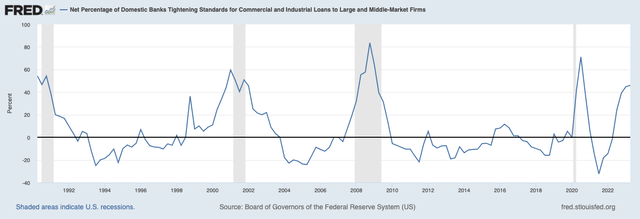
If we look at lending standards, we see that they have tightened across the board, from real estate to consumer loans, industrial loans, auto loans and virtually every other sector.
Federal Reserve (FRED)
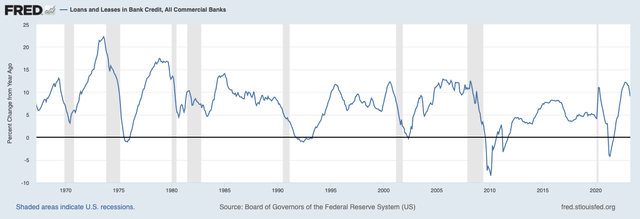
If we look at it from the other side and look at where the loans/leases in bank loans for all commercial banks are, it is only in the last few months that we see some weakness. If we were to follow the same cycle as, say, 2000, we would now be around January/February 2001 levels. Recall, however, that the S&P 500 was also holding up quite strongly up to that point and was only about 10-12% off the all-time highs, just as we are also only 12% off the all-time highs today.
However, it took until late 2002 for credit growth to pick back up, after which the S&P 500 also bottomed out in February 2003 and was down nearly 50% from the all-time highs of early 2000. What we are trying to indicate here is that this bottoming out process may take a while and that we think we are just getting started, given the tightening in credit markets.
Federal Reserve (FRED)
Despite the 3-month 10-year spread inverting in mid-2006, equity markets remained resilient over the next 18 months, with the S&P 500 even reaching new all-time highs in October 2007. What we are trying to imply here is the fact that while it is possible that the S&P 500 could push higher in the next few months, we believe it is destined to meet its destiny later this year when credit tightening finally begins to take effect.
As for the labor market, many market participants continue to point out that they believe there will be no recession because the labor market is still so strong. But the reality, in our view, is that the unemployment rate will not skyrocket until the yield curve has really steepened, and short-term interest rates have been lowered, and we are nowhere near that point now. In both 2000 and 2008, the labor market remained robust during the inversion of the 3-month to 10-year interest rate spread.
Federal Reserve (FRED)
Deposit Flight Is Fine – Until It Isn’t
Returning to credit conditions and bank lending: an economy that does not expand its lending is generally an economy that does not grow. And recently, banks’ willingness to expand their loan portfolio or risk appetite has been shallow at best.
Banks only borrow short and lend long, and with the Federal Reserve raising interest rates so aggressively, they just have a mismatch in funding costs. Keep in mind, for example, that these banks typically take about two years to reprice their loan books. If banks are getting an average yield of 4-4.5% on the assets they lend long, and have to pay funding close to the Fed Funds on deposits, which is currently 5.06%, then you can understand why banks are not eager to expand loan volume or take on more risk. A recent NYU paper also addressed this point, stating that the average time that interest rates are fixed is around 3.9 years, indicating this duration mismatch. Interest rates should never have been raised so quickly, yet the Fed decided to go ahead with it.
What has made this worse recently is the fact that it is much easier to withdraw deposits from institutions that don’t pay enough on their CDs and the ability to park them somewhere else for a nice return. Even in 2008, people did not have iPhones that they could use to get instant access to yield. Recently, Apple Card (AAPL) users can get 4.15% APY with a few clicks. Even some accounts at Interactive Brokers (IBKR) get a 4.58% return on their cash balance. And unlike 2000 and 2008, anyone can now transfer money.
The addition of short-term bond ETFs with, for example, BlackRock’s 0-3 month treasury ETF (SGOV) has not made things easier for banks. Why put money in a savings account or a CD with a 0.05% yield when you can earn 5% on that same money by simply buying an ETF? We believe this dynamic has changed dramatically.
Federal Reserve (FRED)
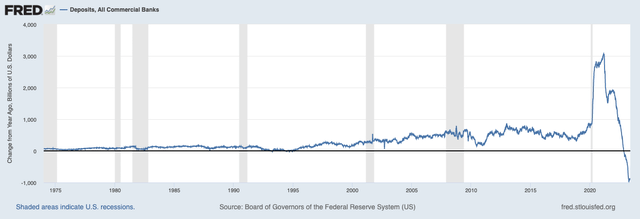
If we look at the drop in commercial bank deposits from $18.12T to $17.24T right now, it is a very unusual scenario because bank deposits have usually only increased steadily over the past few decades. The last time deposits fell by more than 5% was in 1921 and between 1929 and 1933.
It is important to note that deposits are a liability for a bank, and an asset for the customer who deposited the money with the bank. When people withdraw their deposits, banks have to raise more capital. And if that is not possible through the debt/equity market, they have to sell assets that are not yet marked to market. And that’s where a NYU study comes into play, stating that unrealized losses on total bank credit are about $1.7T, while the equity is only $2.1T. In other words, deposit flight is not a problem until it is.
The reality is just that the more deposits flee the system, the more assets need to be sold and the higher these realized losses will become. And while FDIC-insured deposits are fine, it may also be important to point out that about $7.8T of the previously mentioned $17.2T are uninsured deposits. Here is a perfect excerpt from the study that summarizes it:
Even if only half of uninsured depositors decide to withdraw, almost 190 banks with assets of $300 billion are at a potential risk of impairment, meaning that the mark-to-market value of their remaining assets after these withdrawals will be insufficient to repay all insured deposits. If uninsured deposit withdrawals cause even small fire sales, substantially more banks are at risk.
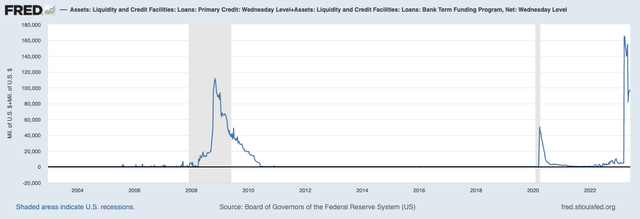
And while the Bank Term Funding Program (BTFP) and the opening of the discount window have put out some of the fires, these are only temporary measures and also cost these “zombie banks” to tap into these credit facilities. Recently, discount window lending fell, while the BTFP continued to rise this week.
Federal Reserve (FRED)
But as we indicated earlier, we think the current deposit flight has less to do with uninsured deposits and more to do with the delta between what banks offer on CDs and the ease of withdrawing money from institutions and getting a yield close to the Fed Funds Rate. As it stands, money just keeps flowing out of banks into money market funds etc. at record rates, and that’s a problem.
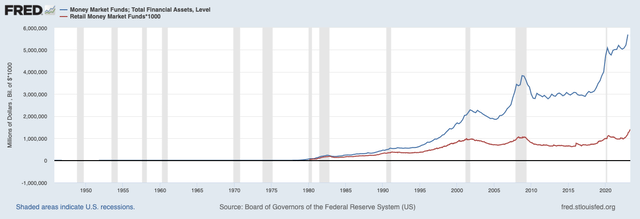
Federal Reserve (FRED)
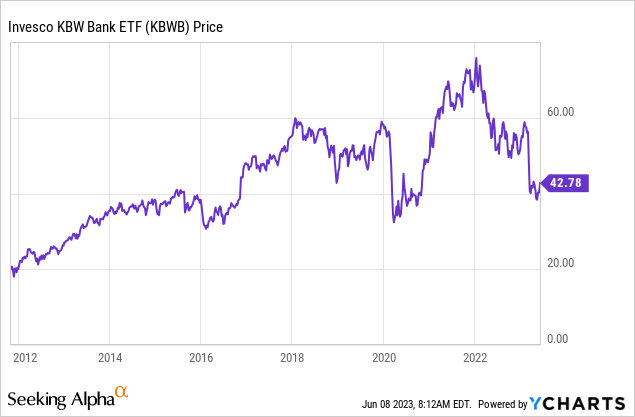
The main conclusion of this banking crisis is that the yield curve is still inverted, that the Federal Reserve raised interest rates too quickly until something broke, and that banks are increasingly unwilling to extend credit because they are currently just trying to survive. The implications for the S&P 500, in our view, are that it is doomed to go lower if credit tightens significantly, earnings decline and the U.S. enters a recession.
Fool In The Shower
When we talk about raising interest rates too quickly, we believe an old metaphor attributed to Milton Friedman that central bankers are “a fool in the shower” is appropriate here.
The metaphor links the actions of central banks to a person trying to change the temperature of the water in the shower. When the fool realizes the water is too cold, he turns on the hot water. However, it takes a while for the water to get hot, and the fool turns on the hot water all the way because he is impatient, and ends up burning himself. Fed policy works the same way, with monetary policy having long and variable lags. It is generally believed that it takes about 12 to 18 months for interest rate changes to take effect.
And knowing that the Federal Reserve has only recently begun thinking about pausing interest rates, it may very well take until the second half of 2024 for these latest rate hikes to take effect. Interestingly, the Federal Reserve did not begin raising interest rates until March 2022, meaning it took until March 2023 for the first effects of the initial 25bp rate hikes to be felt. Yet by March 2023, inflation had already fallen from nearly 9% to 4.99%. So our question becomes: was the cooling of inflation due to the Fed, or was it just the economy stabilizing after the disruptions between 2020 and 2022?
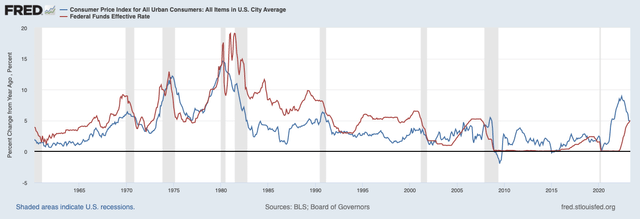
Federal Reserve (FRED)
We believe the Federal Reserve is not even that focused on fighting inflation, but rather trying to restore their credibility after Fed Chairman Powell told the public on TV in 2020 that they had the ability to “create/print money,” then two years later inflation became an issue.
The Federal Reserve doesn’t print money, which leads to inflation. Programs like QE don’t result in money printing, they create bank reserves, which is a common misconception. Bank reserves are not money. If banks are not willing to lend money, it is not “printing money” that leads to inflation, because you are only insuring the deposit base in the banking sector. A 2010 study called “Money, Reserves, and the Transmission of Monetary Policy” actually debunked this:
Changes in reserves are unrelated to changes in lending, and open market operations do not have a direct impact on lending. We conclude that the textbook treatment of money in the transmission mechanism can be rejected. Specifically, our results indicate that bank loan supply does not respond to changes in monetary policy through a bank lending channel, no matter how we group the banks.
But getting back to the Fed’s alleged inflation problem, the CPI by their standards and the BLS currently stands at 4.96% annualized. However, a large component consists of shelter, which we see as a lagging indicator. According to their own measurements, the CPI excluding shelter currently stands at 3.39% YoY.
However, if we look at our alternative measures of inflation, they tell a very different story. Penn State, for example, has developed a very good alternative inflation index by replacing rental and owner-occupied housing rents with their own index, creating a quality-adjusted net rent measure using data such as the Commercial Property Index and average RCA cap rates. And while everyone prefers data from the BLS, we believe this index is more forward-looking and accurate, even knowing that this will not make us the most popular in the economic community by disfavoring government data.
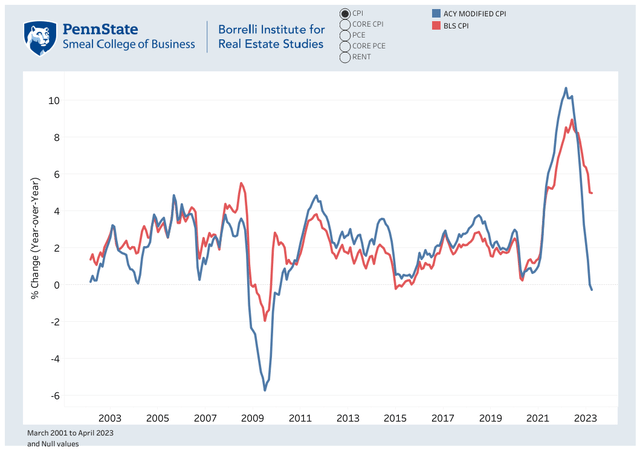
PennState
According to their index, CPI currently stands at -28 bp YoY, with Core CPI currently at -1.04%, which is in line with a decline similar to that in 2008, when Core CPI stood at -3.61% at the low point according to their measure. They also have their own PCE measure which stands at 2.02%, and Core PCE which stands at 2.04%.
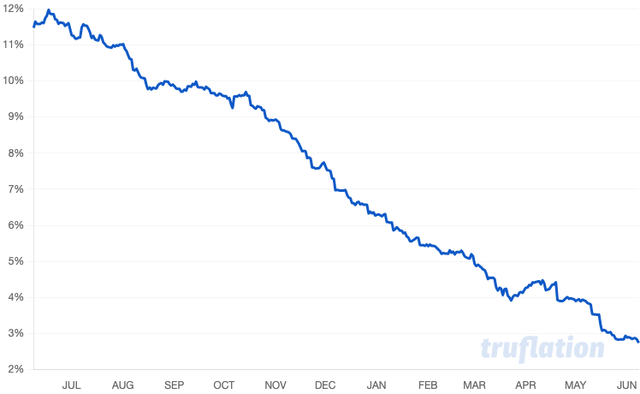
Another daily inflation gauge, Truflation, also states that inflation is currently at 2.74% YoY. Truflation uses 10 million data points updated daily to get their daily inflation gauge. Unlike the CPI, as measured by the BLS, Truflation measured inflation at its peak closer to 12% last year. And while the U.S. CPI is currently at 2.74%, the U.K. measure indicates that inflation in the U.K. is still red-hot compared to the U.S., currently at 13.40% YoY.
Truflation
In short, we are not surprised that the yield curve is as inverted as it is now, since the Fed is fighting inflation on the basis of data that seem backward-looking and do not take into account the delays in the transmission of their monetary policy. We would even go so far as expecting CPI to approach 0% by the end of this year.
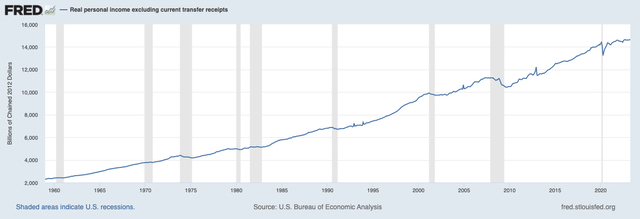
As in 2000, 2008 and 2019-2020, we think the Federal Reserve will be forced to cut interest rates dramatically and return to stimulating the economy to fight deflation, not inflation. Speaking of inflation, one thing that has not been inflated is real disposable income, which has remained virtually flat after 2020, once again dispelling the myth of a wage-price spiral.
Federal Reserve (FRED)
Student loans are also expected to resume briefly, after it was included in legislation to raise the debt ceiling. This 3-year pause, expected to resume at the end of August, is expected to put further pressure on U.S. consumers.
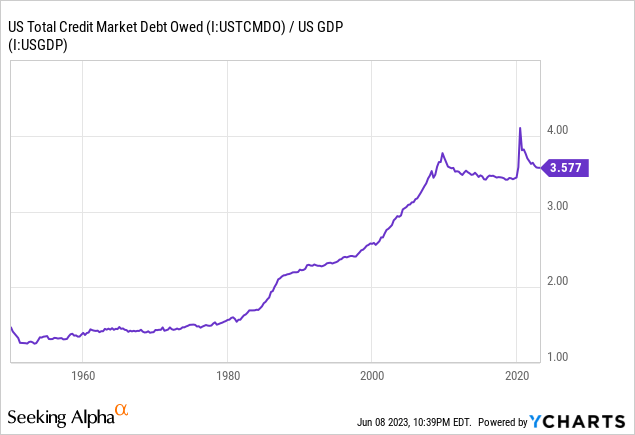
Furthermore, federal regulators, who announced this week that they are preparing new banking rules that would force large banks to increase their capital requirements and hold 20% more capital on average, likely threaten to put the final nail in the coffin of the already poor credit conditions that are fueling the deflationary spiral. If we also take into account the size of the outstanding debt relative to previous periods of monetary tightening, the rates are currently hugely burdensome to the economy.
With total debt/GDP closer to 3.5x, rather than 1.5x during the 1980s, today’s Fed Funds of 5.25% may be an understatement when compared to the 1980s. If we were to compare today to the 1980s and adjust for debt/GDP, the rates would be closer to 12.5%.
S&P 500 Implications
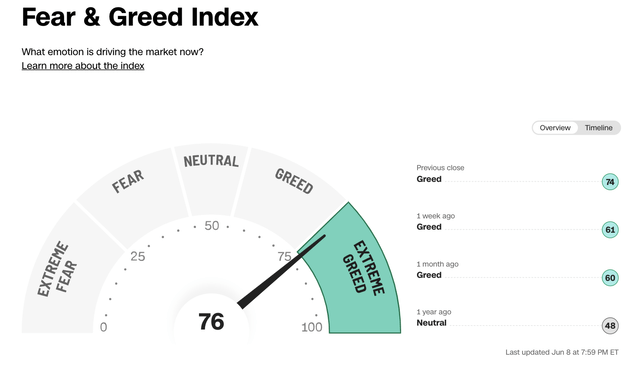
The implications of all this information for the S&P 500 are quite diverse. First, looking at investor sentiment, we see that it has currently reached extreme greed. While some may think participants are bearish, it may also be important to point out that we recently had an AI boom, with Nvidia (NVDA) crossing $1T at one point and the S&P 500 still being up 12% YTD, whilst earnings have been declining.
CNN Markets
Earnings for the S&P 500 have fallen in recent quarters but have held steady until today. According to Bloomberg, earnings for the first quarter fell about 2.9% year-on-year. Operating profit margin forecasts for the S&P 500 for both 2023 and 2024 have continued to disappoint in recent months, while the S&P 500 has continued to rise.
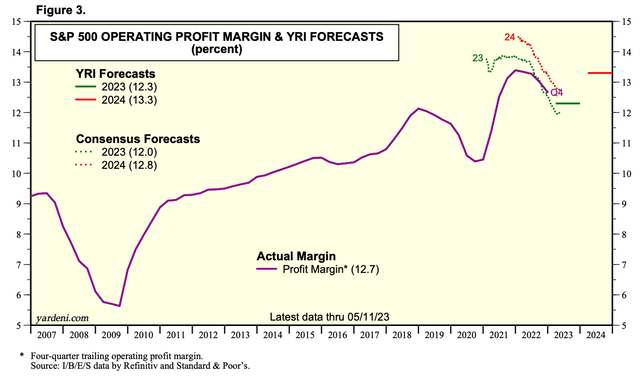
Yardeni Research
If we look at the S&P 500 Shiller PE ratio/ CAPE ratio, we see that it is currently heading north again and has crossed 30.05, as profits have fallen slightly while the index has moved higher.
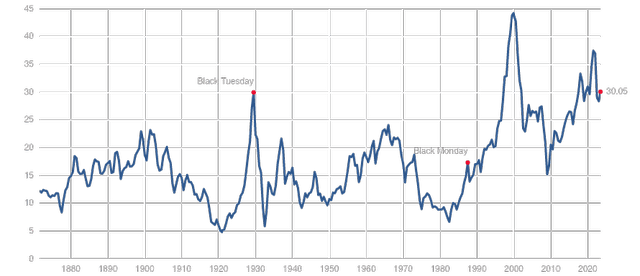
Multpl
Comparing this with research that has looked at the relationship between CAPE and real returns over the next 15 years in various equity markets, we think investors should be concerned about future returns. At a CAPE ratio of 30x, which we are currently at, equity markets have historically averaged only 2% real returns over the next 15 years, with extremes of 4% and -2% real returns.
We fully believe that there is a scenario in which the S&P, similar to 2000 and 2007, does not provide investors with real returns for the next 5–10 years.
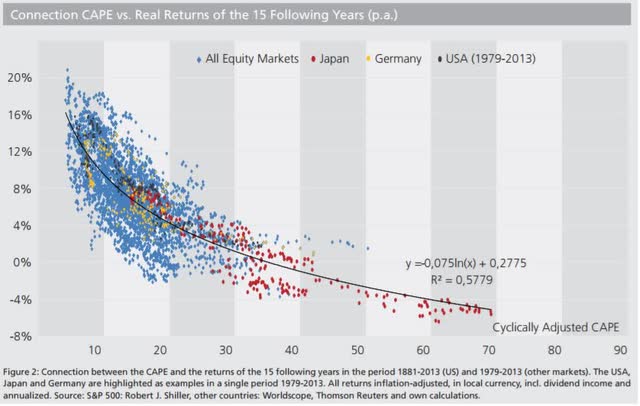
S&P 500, Robert J. Shiller, Worldscope, Reuters
Even if we look at the regular P/E ratio, which is currently close to 25 based on the 12-month trend, you essentially get a 4% earnings yield. If we set this against the risk-free rate, which is 5.25%, we don’t see why the risk/reward would be in favor of buying the S&P 500.
If growth were near the recent historical average of 2%, you are taking a tremendous risk for a 6% nominal return compared to a 5.25% risk-free rate. This 75 bp premium does not seem nearly enough to us, when the yield curve is inverted, a credit crunch seems imminent and the risk of earnings declines is high. In recent weeks, the 2-year yield has risen along with the S&P 500. We expect one will have to give way.
It might also be worth pointing out that Apple and Microsoft (MSFT) have recently accounted for nearly 15% of the S&P 500 index, with a few other tech giants added, that amounts to 24%. These stocks have recently kept the S&P 500 afloat. And we think they are also richly valued.
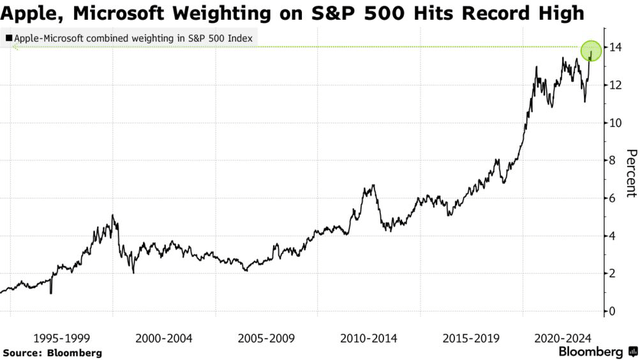
Bloomberg
The Bottom Line
We think the S&P 500 is currently significantly overextended and that we could be on our way back to the October lows very soon. However, we would be hesitant to go short in the index, given that the market can probably remain irrational for longer than we can remain solvent.
With that said, we would be very inclined to buy both the short-end and long-end of the Treasury curve, as we believe both growth and inflation will be far below target by the end of the year. For example, if our assumptions about earnings deterioration are correct, the index could easily return to the $3510 October 2022 levels at 18x earnings at $195.
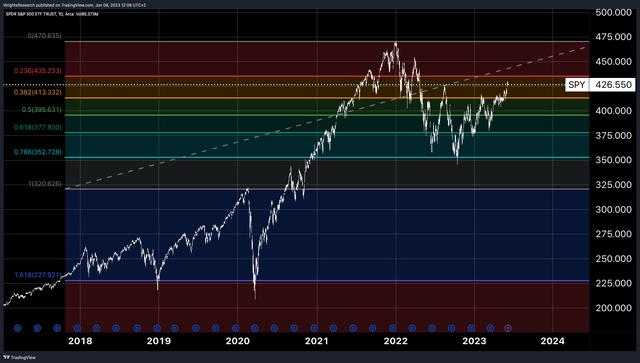
Tradingview, Wright’s Research
Read the full article here


