
Trends Reflect Human Interpretation of Fundamentals
Bullish trends occur when market participants interpret all the fundamental data in a manner that is favorable for future economic outcomes. This concept is not unique to any one period; it always applies. Market conditions are most favorable when trends are constructive on daily, weekly, and monthly timeframes, which is a reflection of the interpretation of the fundamentals. Thus, to better understand bull/bear odds in June 2023, it is helpful to review trends on multiple timeframes.
Monthly Trends Remain In Secular Bull Mode
Secular bear markets are rare and are associated with serious and prolonged economic problems. Stock market drawdowns in secular bullish trends tend to be associated with soft economic landings or mild recessions. Before we review the status of the longer-term trend in 2023, it is helpful to understand what a secular bear looks like and what a secular bull looks like.
1929-1932 Recession and Bear Market
In the 1929-1932 secular bear market, the Dow lost approximately 89% of its value. We will examine the S&P 500 (NYSEARCA:SPY) in this article to keep things consistent. Notice on the chart below how the S&P 500 dropped below the blue 50-month moving average and the moving average began to roll over. Market participants were not confident enough about future economic outcomes to buy stocks when the S&P 500 reached the 50-month moving average, a common occurrence in secular bear markets (see highlighted area).
CCM (stockcharts.com)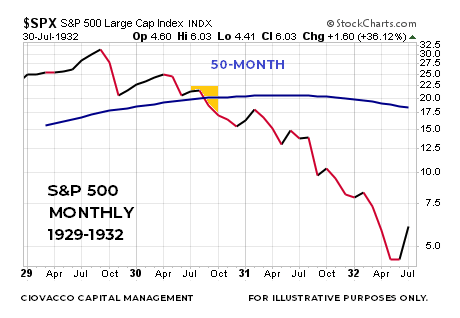
1973-1974 Recession and Bear Market
Even though the combination of fundamentals were significantly different, notice how similar the 1973-1974 bearish trend below looks to the 1929-1932 case above.
CCM (stockcharts.com)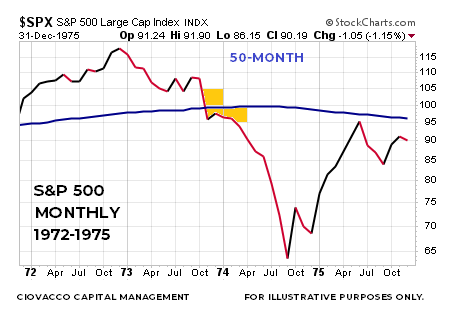
2000-2002 Recession and Bear Market
Like the 1929-1932 and 1973-1974 cases, the monthly chart during the 2000-2002 bear market has a very similar look, indicating market participants were highly concerned about future economic and corporate outcomes. The long-term bearish trends look similar even though the primary fundamental drivers in the three cases were significantly different.
CCM (stockcharts.com)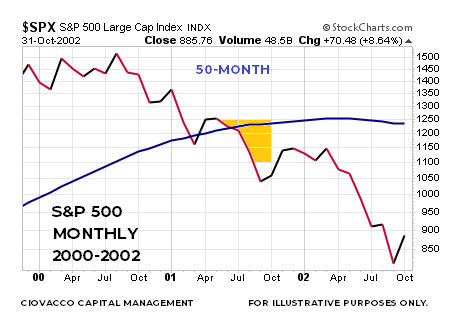
2007-2009 Recession and Bear Market
The S&P 500 (VOO) was already below the 50-month moving average when Lehman Brothers declared bankruptcy in September 2008. Once again, the secular bear market below looks similar to those shown above.
CCM (stockcharts.com)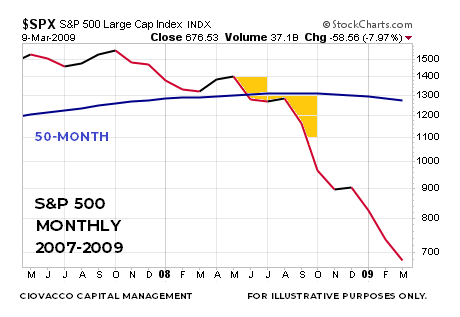
What Does a Secular Bull Look Like?
During secular bullish trends, the shift from bearish sentiment back to bullish sentiment typically occurs before the S&P 500 makes a decisive and lasting break below the 50-month moving average. This speaks to the magnitude and duration of the fundamental issues; they tend to be more muted in secular bull markets.
1986-1995 Bullish Trend
In markets, nothing is binary or absolute, but typically long-term bullish trends find buying support near the 50-month moving average, which is in stark contrast to the bearish cases covered above. In the 1986-1995 S&P 500 window shown below, buyers regained control of the market near an upward-sloping 50-month in 1987, 1990, and 1994.
CCM (stockcharts.com)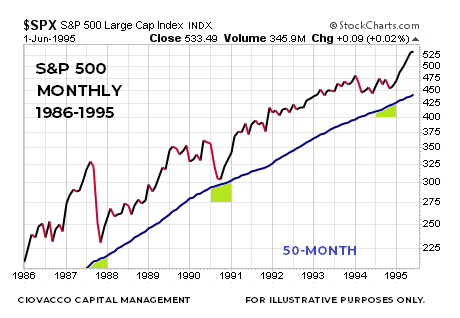
Buyers stepped in near the green highlighted areas above because they believed the economy and corporate earnings would improve in the coming months/years.
How Does The Long-Term Trend Look in 2023?
The S&P 500 made a stand near an upward-sloping 50-month moving average near the COVID low in 2020 and near the low in October 2022, which looks more like a secular bull market relative to a secular bear market.
CCM (stockcharts.com)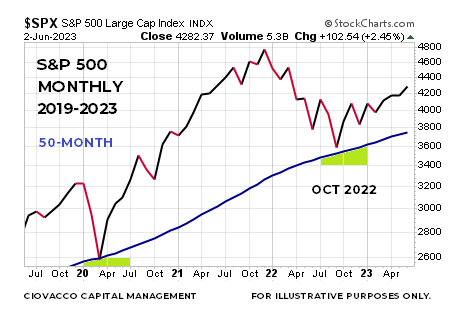
The primary fundamental drivers between October 2022 and June 2023 are the belief that peak inflation occurred in 2022, the Fed is close to the end of the current interest rate-hiking campaign, consumers still have excess savings in the wake of the greatest monetary and fiscal stimulus in U.S. history, and the economy appears to be in a position to avoid big hits to employment, spending, and corporate earnings.
Observable Weekly Improvement
If the 2023 market was in the process of morphing into a secular bear, we would expect to see deterioration in the market’s weekly trend, increasing the odds of breaching the 50-month moving average. That is not what we have currently.
According to the weekly Ichimoku cloud chart below, investors with intermediate-term timeframes are interpreting the fundamentals in a more favorable light. Ichimoku clouds look scary and complex, but they are easy to understand and quite helpful in terms of monitoring the interpretation of present-day fundamentals.
CCM (stockcharts.com)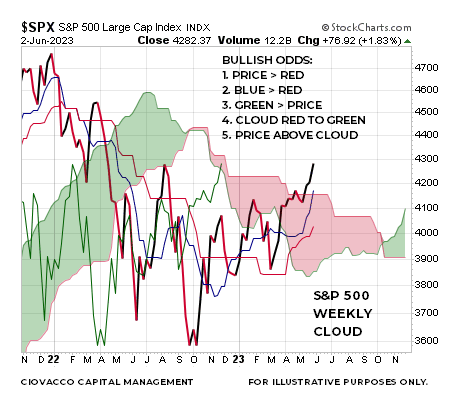
There are five major data points to assist with trend identification on the weekly S&P 500 cloud chart above. In 2022, all five flipped from bullish to bearish, a reflection of concerns related to inflation, interest rates, and Fed policy. In 2023, all five trend identifiers have flipped back into the bullish camp, which increases the odds of October 2022 being the final low in the bear market. A May 22 article demonstrated that when the weekly trend shifts in this manner, a major S&P 500 low tends to be in place and the longer-term bias is for the market to push higher.
S&P 500’s Daily Trend
The chart below reflects every present-day concern, including the Treasury General Account, liquidity, inflation, interest rates, earnings, valuations, credit risk, etc. If you can ask “what about”, then it is already known by market participants and incorporated into the chart below. The moving averages span between the 50-day and 250-day. The current look shows a bullish convergence of trends on multiple timeframes, telling us market participants that focus on shorter, intermediate, and longer-term timeframes are all interpreting the fundamentals of the day in a more favorable light. Confidence about future economic outcomes is significantly higher today relative to Q3 2022.
Ichimoku Cloud 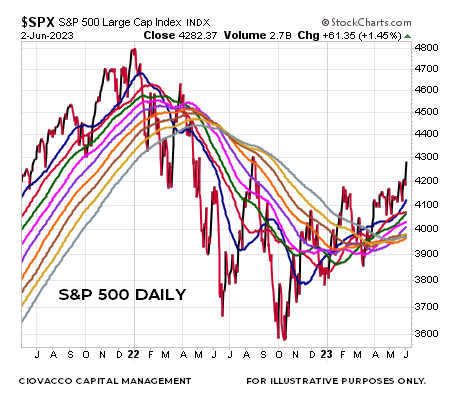
Moral of the Story
The S&P 500’s trend is constructive on daily, weekly, and monthly timeframes. As shown via the monthly charts above, the S&P 500’s rally in October 2022 aligns with the look of a secular bullish trend. If the monthly chart is going to deteriorate, we would expect to see weakening trends on both daily and weekly timeframes. That is not what we have in June 2023.
As stated in the opening paragraph, bullish trends occur when market participants interpret all the fundamental data in a manner that is favorable for future economic outcomes. The same message comes from a recent review of the fundamental data the National Bureau of Economic Research (NBER) uses to determine if the U.S. economy has entered a recession. Common sense tells us recessions tend to occur when:
- people lose their jobs or are afraid of becoming unemployed, which in turn
- causes them to curtail spending, especially on big ticket items or discretionary goods/services;
- curtailed spending eventually shows up in corporate earnings;
- weaker corporate earnings result in lower stock prices/portfolio values, which
- tends to curtail spending even further.
St. Louis Fed / FRED database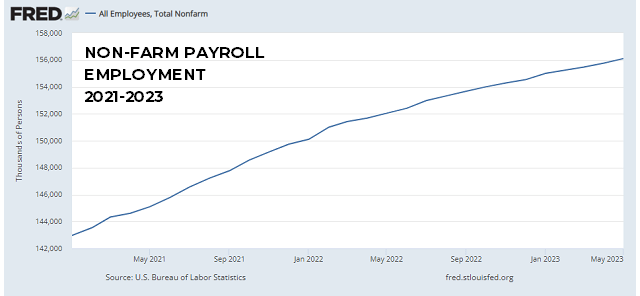
Are people losing their jobs in 2023? Not according to the chart above. Non-farm payrolls increased last Friday, indicating job gains, rather than job losses. Are people afraid if they lose their job they won’t be able to find a new one? The latest JOLTS survey showed there are over 10 million jobs available. Thus, there is currently no major driver for consumers to significantly curtail spending, which makes it difficult to call for a big hit to corporate earnings and stocks, given what we know today.
Bearish Concerns
A weight of the evidence approach examines all the facts, favorable and unfavorable. While the S&P 500 has favorable looks on multiple timeframes, the equal-weighted S&P 500 (RSP) was down 2.28% YTD on March 17 and finished May down 0.66% YTD, which speaks to less-than-optimal market breadth. Weak breadth is also reflected in new highs relative to new lows, which has not turned the corner in a convincing manner. Stock market bulls want to see the market’s rally broaden out, which remains possible given the long-term damage to the 11 S&P 500 sectors remains muted.
Inflation remains well above the Fed’s target, which means while the Fed may pause in June, future rate hikes cannot be ruled out. If the Fed keeps hiking, the economic impact could lead to job losses, curtailed spending, lower corporate profits, and a recession. This bearish scenario is currently not supported by the market charts, nor the fundamentals, but must be respected as long as inflation remains elevated.
Editor’s Note: This article covers one or more microcap stocks. Please be aware of the risks associated with these stocks.
Read the full article here

