
Market Recap
2023 has been a mixed year for stocks to say the least. If your portfolio has decent exposure to technology stocks more likely than not you’re having a pretty good year thus far, if you don’t own any tech you may not be as happy this year. That’s how the market works, sometimes you win, sometimes you lose, but there are still 7 months to go in 2023 and in the current market things can shift rather quickly.
The SPDR S&P 500 Trust ETF (SPY) added 0.46% in May, driven by technology stocks, and is up nearly 10% year-to-date. Vanguard’s High Dividend Yield ETF (VYM) posted a sour loss of 5.13% in May and is down 5.67% year-to-date. My watchlist from the prior month did not fare any better, posting a loss of 6.10%, it is however still positive on the year, +1.73%. Clearly dividend focused strategies are not doing so great in 2023 given that there aren’t many technology stocks that pay a heathy dividend yield.
This isn’t reason enough to deviate from a dividend oriented strategy, and you shouldn’t really expect to beat the broad market all of the time investing in quality high yield dividend stocks. I think it’s better to view the significant losses from May as an opportunity to dollar-cost-average and generate higher dividend income going forward, rather than as a setback.
The main purpose of a high dividend yield portfolio is not to outperform the broad market but to generate a passive income stream that is relatively safe, reliable, and one that can grow in the future. The top 10 stocks on my watchlist for June 2023, collectively, offer a 5.08% dividend yield that is more than double the dividend yield of the S&P 500. These 10 stocks have also grown their dividends at a historical rate of 35.55% per year during the last five years. Collectively, all 10 stocks appear to be potentially about 36% undervalued right now based on dividend yield theory.
The best way to create a strong high yield dividend portfolio is with a buy-and-hold strategy. This strategy forces you to think about the stocks you decide to invest your capital into as the plan is to hold the positions indefinitely. Applying this approach over the long term while focusing on potentially undervalued stocks allows investors to generate alpha through capital appreciation. While this may not pan out for every position, diversifying your high-yield portfolio across 20 or more unique stocks will increase the odds of picking up shares of certain stocks when they are trading for bargain prices. The beauty of a long-term outlook is time; you can sit back and wait for the valuation to revert to historical norms, all the while collecting a generous passive income stream.
Watchlist Criteria
Creating the high yield watchlist, I had four areas of interest that I focused on: basic criteria, safety, quality, and stability. First off, the basic criterion aims to narrow down the list of stocks to those that pay a dividend, offer a yield above 2.75%, and trade on the NYSE and NASDAQ. The next set of criteria focuses on safety because that is a crucial part of a high yield investing strategy. The filter excludes companies with payout ratios above 100% and companies with negative 5-year dividend growth rates. Another level of safety can be associated with larger companies; therefore, the watchlist narrows in on stocks with a market cap of at least $10 billion. The next set of criteria set out to narrow down the list to include higher quality businesses.
The three filters for quality are: a wide or narrow Morningstar moat, a standard or exemplary Morningstar stewardship, and an S&P quality rating of B+ or higher. A Morningstar moat rating represents the company’s sustainable competitive advantage, the main difference between a wide and narrow moat is the duration that Morningstar expects that advantage to last. Companies with a wide moat are expected to maintain their advantage for the next 20 years, whereas companies with a narrow moat are expected to maintain their advantage for the next 10 years. The Morningstar stewardship evaluates the management team of a company with respect to shareholders’ capital.
The S&P quality rating evaluates a company’s earnings and dividend history. A rating of B+ or higher is associated with above-average businesses. The last set of criteria focuses on the stability of a company’s top-line and bottom-line growth. The filter eliminates companies with negative 5-year revenue or earnings per share growth rate. I believe a company that is growing both their top-line and bottom-line has the ability to provide growth to its investors in the future.
All of the stocks that pass the initial screener criteria (49 this month) are then ranked based on quality and valuation. Further, I sort the stocks in descending order based on the best combination of quality and value and select the top 10 stocks that are forecasted to have at least a 12% annual long-term return.
June 2023 Watchlist
Here is the watchlist for June 2023. There are three changes from the prior month: Canadian Imperial Bank of Commerce (CM), Corning (GLW) and Unilever (UL) drop off and are replaced by Best Buy (BBY), Goldman Sachs (GS) and Paychex (PAYX). The data shown in the image below is as of 5/31/23.
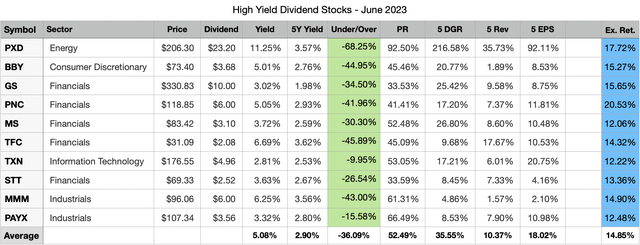
Created by Author
All of the selected stocks this month appear to be potentially undervalued based on dividend yield theory.
The expected rate of return shown in the last column is computed by taking the current dividend yield plus a return to fair value over the next 5 years and a discounted long-term earnings forecast.
Please keep in mind that my return forecasts are based on assumptions and should be viewed as such. I am not expecting that these 10 companies will hit the forecasted returns. What I do expect is that these 10 companies have the potential to offer better returns during the next 5 years compared to the 39 high yield stocks that passed my initial filters but ranked worse in quality and valuation.
Past Performance
The top 10 list for May did not perform well, collectively the 10 chosen stocks fell by 6.10%. This was 0.97% worse than VYM and 6.56% worse than SPY. The watchlist was off to a good start this year but hit a brick wall last month as most dividend stocks did not fare well. Since inception, which was 31 months ago, the watchlist trails VYM by 1.89% and SPY by 0.39%. Just a month ago the watchlist was outpacing SPY by 2.65%, but a loss of 6.56% will set you back a little bit.
I do not expect that this watchlist will beat VYM or SPY every month. However, I believe that a buy-and-hold investing approach leveraging the stocks presented on this watchlist will generate long-term alpha compared to the broad market. I also have a personal target rate of return of 12% that I believe will be attained by this watchlist when measured over long periods of time.
Following May, the long-term annualized rate of return for the watchlist decreased from 14.50% to 11.26%. The 2.5 years of history I have measured thus far is a long period of time but I would really like to have 5 or 10 years of results before I start passing more judgment.
|
Date |
Watchlist |
ALL |
VYM |
SPY |
|
6 month |
-4.49% |
-7.67% |
-8.96% |
3.37% |
|
3 month |
-3.83% |
-6.18% |
-4.50% |
5.85% |
|
1 month |
-6.10% |
-6.06% |
-5.13% |
0.46% |
|
YTD |
1.73% |
-3.74% |
-5.67% |
9.69% |
|
Since Inception |
31.73% |
37.27% |
37.58% |
32.91% |
|
Annualized |
11.26% |
13.04% |
13.14% |
11.64% |
May was a little bit of a setback but the watchlist is still performing well this year compared to VYM.
Individual watchlist returns for May 2023 were:
- (TXN) +4.77%
- (CM) -1.76%
- (TFC) -4.66%
- (STT) -5.87%
- (GLW) -6.42%
- (PXD) -6.79%
- (MS) -9.13%
- (UL) -9.27%
- (MMM) -10.83%
- (PNC) -11.07%
Top 5 performing past and present watchlist stocks in May 2023:
- (AVGO) +28.96%
- (CSCO) +5.12%
- (TXN) +4.77%
- (DRI) +4.34%
- (QSR) +3.96%
Top 5 Stocks by total return since joining the watchlist:
- (AVGO) +88.13% (25 months)
- (PFG) +84.72% (31 months)
- (MRK) +65.76% (25 months)
- (GD) +64.93% (31 months)
- (BMO) +54.97% (31 months)
Top 5 Stocks by Average Monthly return since joining the watchlist:
- (FDX) +5.08% (8 months)
- (SWKS) +2.68% (8 months)
- (AVGO) +2.56% (25 months)
- (MRK) +2.04% (25 months)
- (PFG) +2.00% (31 months)
In total there have been 76 unique high yield dividend stocks that have appeared in the top 10 list during the past 2.5 years. Out of these 76 unique stocks 52 have a positive total return since first appearing on the top 10 list. The average total return for these 52 stocks is 27.51%. The average loss for the 24 stocks that have negative total returns is -20.34%. Here are all 76 stocks, their total return since inception and the number of months since they first appeared in the top 10 list.
|
Symbol |
Since Inception |
Count |
|
AVGO |
88.13% |
25 |
|
PFG |
84.72% |
31 |
|
MRK |
65.76% |
25 |
|
GD |
64.93% |
31 |
|
BMO |
54.97% |
31 |
|
PGR |
50.10% |
28 |
|
CSCO |
49.19% |
31 |
|
JPM |
48.65% |
31 |
|
FDX |
48.64% |
8 |
|
GIS |
47.52% |
22 |
|
PEP |
46.51% |
31 |
|
TD |
41.58% |
31 |
|
RY |
39.01% |
31 |
|
LMT |
36.80% |
31 |
|
SO |
35.42% |
31 |
|
SRE |
32.86% |
27 |
|
ATO |
32.45% |
18 |
|
BNS |
30.59% |
31 |
|
CVS |
29.10% |
31 |
|
EPD |
27.89% |
22 |
|
CPB |
27.58% |
20 |
|
PAYX |
27.30% |
28 |
|
K |
26.45% |
27 |
|
MTB |
25.24% |
31 |
|
BK |
25.00% |
31 |
|
STT |
24.45% |
31 |
|
SNA |
24.25% |
16 |
|
SWKS |
23.61% |
8 |
|
CM |
23.49% |
31 |
|
QSR |
21.08% |
21 |
|
PM |
20.58% |
27 |
|
XEL |
18.71% |
27 |
|
RCI |
17.55% |
31 |
|
TXN |
16.47% |
11 |
|
EVRG |
15.97% |
31 |
|
DRI |
15.26% |
22 |
|
CMS |
14.43% |
27 |
|
TRP |
14.43% |
31 |
|
CMCSA |
11.35% |
9 |
|
AMGN |
10.87% |
31 |
|
DTE |
10.80% |
31 |
|
HBAN |
10.48% |
31 |
|
KMB |
10.04% |
28 |
|
BLK |
8.33% |
13 |
|
FAST |
7.97% |
4 |
|
MDT |
6.56% |
6 |
|
HD |
6.16% |
11 |
|
PXD |
3.87% |
3 |
|
CMI |
3.58% |
15 |
|
WEC |
2.52% |
29 |
|
UL |
0.91% |
3 |
|
LNT |
0.38% |
31 |
|
CLX |
-0.69% |
21 |
|
NTRS |
-1.43% |
31 |
|
EOG |
-3.49% |
3 |
|
VZ |
-5.61% |
6 |
|
XOM |
-6.01% |
2 |
|
GLW |
-8.43% |
3 |
|
OKE |
-9.53% |
2 |
|
MS |
-9.81% |
22 |
|
AMT |
-12.16% |
8 |
|
USB |
-15.69% |
31 |
|
UPS |
-17.14% |
15 |
|
TFC |
-18.66% |
31 |
|
DLR |
-19.96% |
15 |
|
INTC |
-22.04% |
31 |
|
HAS |
-22.37% |
31 |
|
BEN |
-24.02% |
17 |
|
BBY |
-24.33% |
17 |
|
PNC |
-25.77% |
3 |
|
TROW |
-26.88% |
16 |
|
BX |
-28.84% |
14 |
|
MMM |
-34.88% |
31 |
|
PARA |
-42.29% |
31 |
|
CMA |
-45.57% |
26 |
|
AAP |
-62.61% |
15 |
Closer Look
Here’s a closer look at the three new stocks on this month’s watchlist: Best Buy, Goldman Sachs and Paychex.
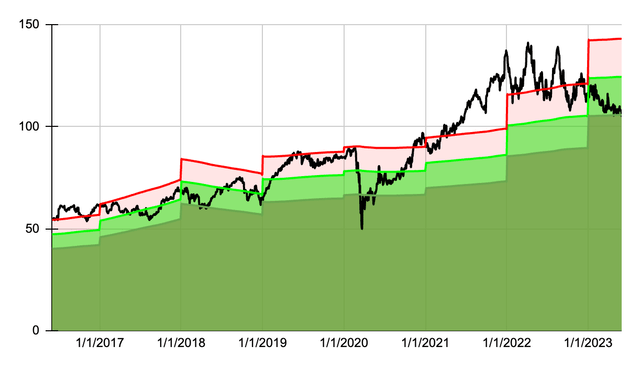
Let’s start with the 7-year dividend yield theory chart for Best Buy.
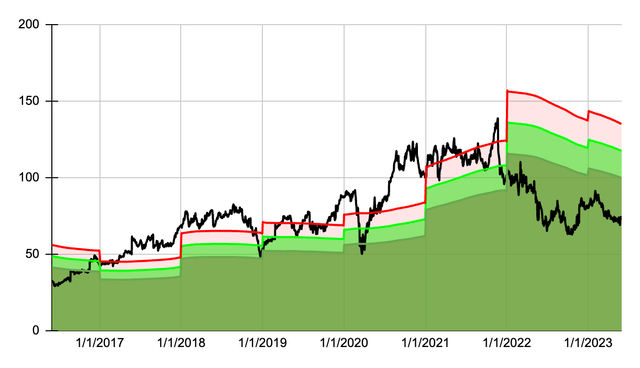
Create by Author
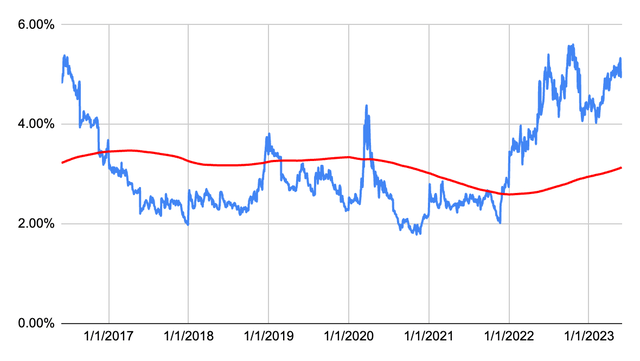
Best Buy’s share price has come down quite a bit since its previous high in late 2021. The stock has trended for a long time in the deep undervalued zone as depicted by dividend yield theory. As shown below the stock is offering historically high yields right now, not seen since mid 2016.
Created by Author
In the dividend growth department, Best Buy has been on an excellent streak since 2018 until this year. The company increased its annual dividend by 4.55% which was considerably lower than the prior 5 increases.
| Year | Dividend | Growth | CAGR |
| 2023 | 3.68 | 4.55% | |
| 2022 | 3.52 | 25.71% | 4.55% |
| 2021 | 2.80 | 27.27% | 14.64% |
| 2020 | 2.20 | 10.00% | 18.71% |
| 2019 | 2.00 | 11.11% | 16.47% |
| 2018 | 1.80 | 32.35% | 15.38% |
| 2017 | 1.36 | -13.38% | 18.05% |
| 2016 | 1.57 | 9.79% | 12.94% |
| 2015 | 1.43 | 98.61% | 12.54% |
| 2014 | 0.72 | 5.88% | 19.87% |
| 2013 | 0.68 | 3.03% | 18.40% |
| 2012 | 0.66 | 6.45% | 16.91% |
| 2011 | 0.62 | 16.00% |
Up next let’s take a look at Goldman Sachs, here is the 7-year dividend yield theory chart.
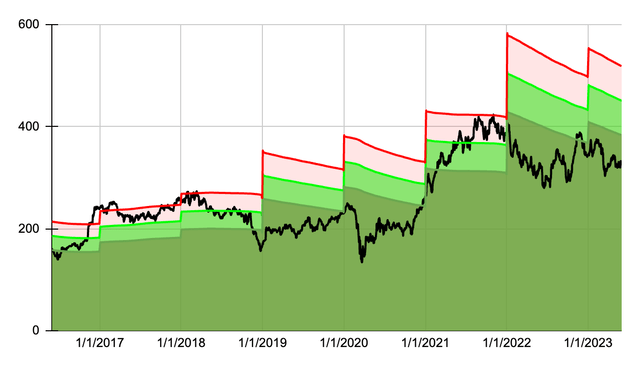
Created by Author
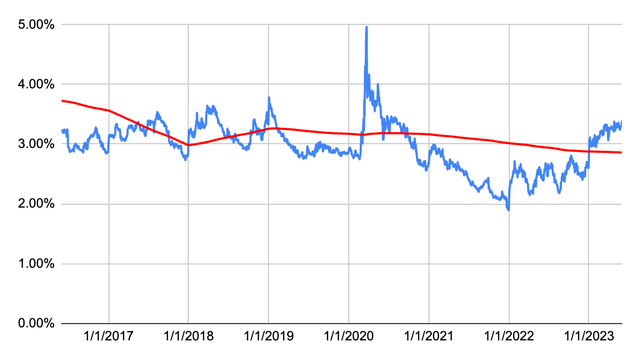
Goldman stock is trading at a discount to fair value as suggested by dividend yield theory. The price has trended lower from its near time highs in late 2021/early 2022, and has seen some increased volatility during the last several months. Continued dividend growth coupled with a stagnating share price means that Goldman’s dividend yield has improved during the last 6 years. Today the stock offers a yield in excess of 3% that investors have not seen since the 2020 pandemic market crash.
Created by Author
In the dividend growth department Goldman has delivered excellent results. The prior 4 years have all seen double digit dividend growth, and even if management does not increase the dividend this year investors will still see double digit year over year dividend growth in 2023. Goldman historically announces its dividend increase with the quarter 3 dividend that should be declared sometime in July.
| Year | Dividend | Growth | CAGR |
| 2023 | 10.00 | 11.11% | |
| 2022 | 9.00 | 38.46% | 11.11% |
| 2021 | 6.50 | 30.00% | 24.03% |
| 2020 | 5.00 | 20.48% | 25.99% |
| 2019 | 4.15 | 31.75% | 24.59% |
| 2018 | 3.15 | 8.62% | 25.99% |
| 2017 | 2.90 | 11.54% | 22.91% |
| 2016 | 2.60 | 1.96% | 21.22% |
| 2015 | 2.55 | 13.33% | 18.63% |
| 2014 | 2.25 | 9.76% | 18.03% |
| 2013 | 2.05 | 15.82% | 17.17% |
| 2012 | 1.77 | 26.43% | 17.05% |
| 2011 | 1.40 | 17.80% |
And finally we have Paychex, here is the 7-year dividend yield theory chart.
Created by Author
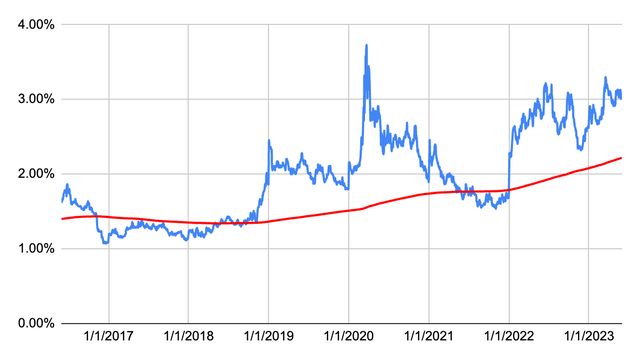
Between late 2020 and the tail end of 2022 dividend yield theory suggested Paychex was overvalued. Only recently have we seen the share price dip below the fair value line, suggesting it’s a good time to take a closer look at this company. Historically Paychex’s dividend yield has hovered around a 3% range, investors had a unique opportunity during the 2020 pandemic crash to lock in a nearly 5% yield. Today the dividend yield sits around 3.3% which is pretty attractive for this payroll provider.
Created by Author
In the dividend growth department Paychex has a mixed history of above average increases coupled with not so good years. The company already raised its dividend this year back in April, with the new dividend paid out in late May. The increase was very good at 12.66% and now it’s on a 2 year streak of double digit increases.
| Year | Dividend | Growth | CAGR |
| 2023 | 3.56 | 17.49% | |
| 2022 | 3.03 | 16.54% | 17.49% |
| 2021 | 2.60 | 4.84% | 17.01% |
| 2020 | 2.48 | 2.48% | 12.81% |
| 2019 | 2.42 | 11.01% | 10.13% |
| 2018 | 2.18 | 13.54% | 10.31% |
| 2017 | 1.92 | 9.09% | 10.84% |
| 2016 | 1.76 | 10.00% | 10.59% |
| 2015 | 1.60 | 9.59% | 10.51% |
| 2014 | 1.46 | 108.57% | 10.41% |
| 2013 | 0.70 | -64.10% | 17.66% |
| 2012 | 1.95 | 56.00% | 5.62% |
| 2011 | 1.25 | 9.11% |
Read the full article here

