The monster rally in Nvidia Corp.’s stock following the semiconductor maker’s stunningly bullish revenue outlook has produced the most oversold reading by one widely followed technical metric since just before the previous record close in November 2021.
But history suggests that overbought doesn’t necessarily mean the rally is over. Although the four other times the stock reached overbought readings as high as they are now did precede pullbacks, three of those pullbacks were short-term in nature, and not enough to derail the longer-term uptrends.
The stock
NVDA,
climbed 2.3% in afternoon trading toward a record close Friday, a day after rocketing 24.4% following the chip maker’s blowout earnings report.
Meanwhile, the Relative Strength Index, known by chart watchers as RSI, rose to an 18-month high of 83.64 on Friday.
The RSI is a momentum indicator that compares the magnitude of recent gains with the magnitude of recent losses. Typically, many believe RSI readings above 70 indicate a stock is overbought, which to chart watchers means it has rallied too far and too fast compared with its historical performance and that investors are likely to cash in some gains.
Many actually interpret an overbought RSI reading as sign of strength, as the ability to become overbought suggests the charted instrument must be in a bullish trend. (Read Constance Brown’s “Technical Analysis for the Trading Professional.”)
Don’t miss: AI stock-market surge underlines this key lesson for traders, RenMac says.
As the chart below shows, Nvidia’s RSI indicator had crossed above the overbought threshold of 70 multiple times in the past five years, but with the latest foray it has passed the extreme overbought line of 80 just five times.
The first three times, an 80+ RSI led to short-term pullbacks in the stock:
- The RSI reached a high of 83.55 on Feb. 19, 2020, the same day the stock closed at a then-record $78.68. The stock tumbled as much as 38.9% over the next month amid the pandemic panic before the longer-term uptrend resumed. The stock rose to a fresh record in less than three months, on May 11.
- The RSI rose to high of 85.00 on Sept. 2, 2020, the same day the stock closed at a then-record $143.46. The stock sank 17.0% in just three sessions, to Sept. 8, but was back at a fresh record close on Nov. 6.
- The RSI climbed to a high of 83.40 on July 6, 2021, the same day the stock closed at a then-record of $206.99. The stock dropped as much as 12.3% over the next eight sessions to July 16, but was back at a fresh record on Aug. 20.
The last time RSI peaked above 80 was Nov. 8, 2021 when it reached 89.17, the same day the stock closed at a then-record $308.04. The stock only pulled back 5.0% over the next seven sessions to Nov. 17, but closed at a fresh record high ($316.75) the very next day.
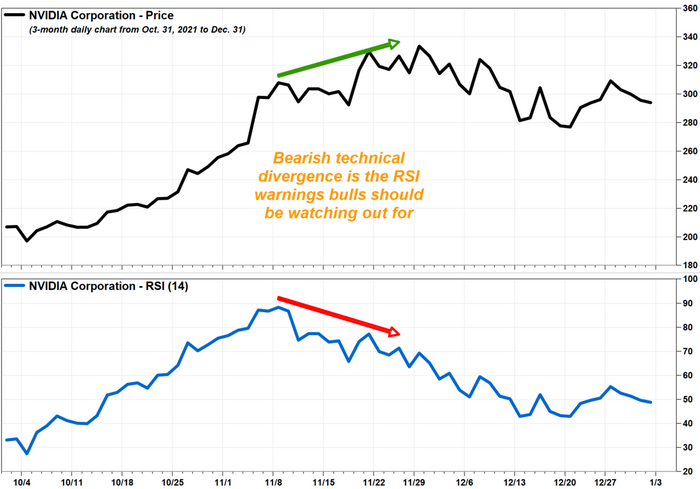
As the stock kept rising to a record $333.76 on Nov. 29, as investors cheered Nvidia’s strength in the data-center and cloud arenas, as well as the company’s opportunities to help build out the metaverse, RSI was actually trending lower to a sub-overbought reading of 69.53 that day. (Read more about bearish technical divergences.)
That pattern, referred to as bearish technical divergence, suggests rallies are taking more and more out of the bulls, leaving them vulnerable to bear attacks.
The subsequent pullback in the stock turned into a full-blown 11-month bear market, as the price plunged 66.4% before bottoming at $112.27 on Oct. 14, 2022.
Basically, while extreme RSI readings have preceded short-term pullbacks in the past, bulls shouldn’t be too concerned until RSI starts trending lower even as stock prices are rising.
It could be a while before that pattern emerges.
Read the full article here

