Equinor ASA (NYSE:EQNR) has become an engine of profitability in the last five years. They lead their peers in gross profitability, operating margins, and returns. In that period, they have generated over 93% of their market cap in free cash flows, providing enormous support for any future increase in capital distribution. The company trades at an attractive multiple, a gross profitability of 0.55 and a free cash flow of nearly 18%. The company belongs in the portfolio of any income-seeking, long-term investor.
Underperforming on The Market
In the last five years, Equinor’s share price has risen by a very tepid 4.26%, compared to a (market-cap weighted) peer group average of over 16%, nearly 57% for the S&P 500 and more than 20% for the Xtrackers MSCI World Energy ETF 1C (XDW0), which tracks the MSCI World Energy Index and will serve as a proxy for the energy industry. However, thanks to the firm’s dividend issuance, Equinor’s total shareholder return (TSR) was 33.5%, compared to a peer group average of 48.08%. Xtrackers MSCI World Energy ETF 1C (XDW0) Equinor’s peer group includes BP p.l.c. (BP), Chevron Corp.(CVX), ConocoPhillips Co. (COP), Eni SpA (E), Exxon Mobil Corp. (XOM), Repsol S.A. (OTCQX:REPYY), Shell plc (SHEL), and TotalEnergies SE (TTE).
Source: Morningstar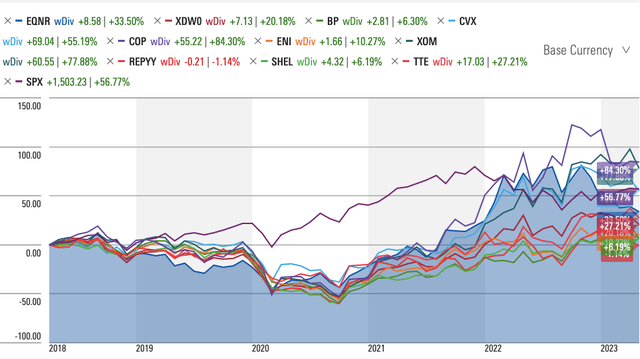
Equinor’s Profitability is on The Rise
Since 2016, when shareholders voted to tie executive compensation to return on average capital employed (ROACE) and TSR, both relative to the company’s peer group. Both these modifiers are equally-weighted. The effect of this is to tie shareholder interests for capital allocation excellence to executive compensation.
This has resulted in the firm’s profitability improving significantly, from a ROACE of -4.7% in 2016 to 55.2% in 2022. This performance improvement has resulted in the company having an above average relative TSR ranking among its peers, and its relative ROACE is in the first quartile among those peers. The firm aims to have an average ROACE of 14% for the 2022 to 2030 period. In the last five years, Equinor’s return on invested capital (ROIC) has risen from 18.8% in 2018 to 64.1% in 2022. The peer group average ROIC is 27.09%.
Source: Equinor ASA Filings and Author Calculations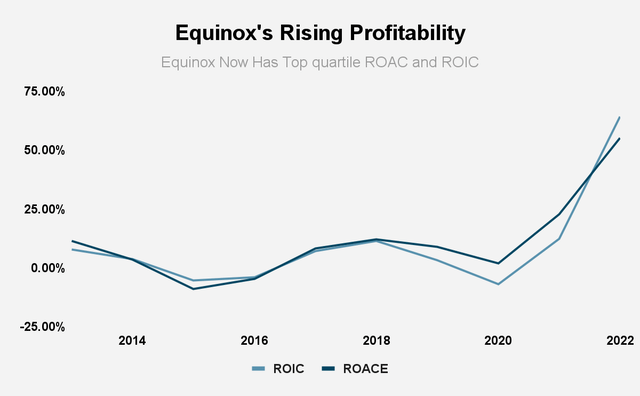
At a more granular level, we can see evidence of this improving profitability. Over the last years, Equinor’s gross profitability has risen from 0.28 in 2018 to 0.55 in 2022, which is far above the 0.33 threshold of attractiveness as found by Robert Novy-Marx. Its peer group average gross profitability was 0.3 in 2022.
The company’s operating margin has risen from 25.3% in 2018, to 52.26% in 2022. In 1Q23, its operating margin was 81.49%, compared to 91.76% in 1Q22 and 85.99% in 4Q22. The peer group average operating margin is 22.36%.
Equinor’s net income rose from $7.54 billion in 2018 to $28.75 billion in 2022, compounding at 30.69% a year. The peer group average net income is $40 billion. The company has been an earnings giant, with 11% of the earnings in its peer group.
Source: Company Filings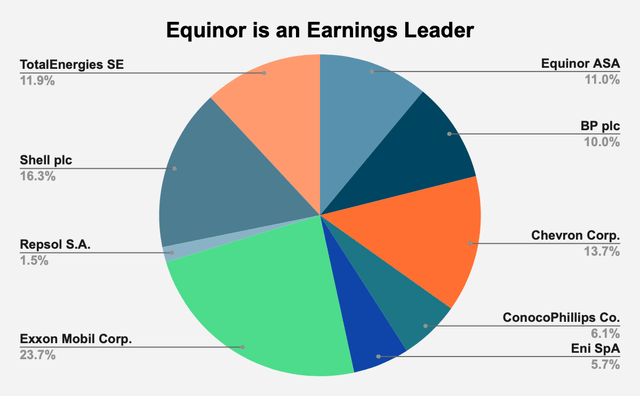
Overall, Equinor’s profitability is greater than that of its peers, with the firm enjoying superior gross profitability, ROIC, and operating margin, compared to its peers.
|
Company |
Ticker |
Gross Profitability |
ROIC |
Operating Margin |
Net Income (in billions) |
|
Equinor ASA |
EQNR |
0.55 |
64.10% |
52.26% |
$28.75 |
|
BP plc |
BP |
0.27 |
21.70% |
18.68% |
$26.12 |
|
Chevron Corp. |
CVX |
0.28 |
22.30% |
20.87% |
$35.78 |
|
ConocoPhillips Co. |
COP |
0.40 |
28.40% |
32.86% |
$15.84 |
|
Eni SpA |
E |
0.20 |
19.50% |
13.10% |
$14.77 |
|
Exxon Mobil Corp. |
XOM |
0.31 |
27.10% |
21.18% |
$61.69 |
|
Repsol S.A. |
REPYY |
0.27 |
2.01% |
14.03% |
$3.97 |
|
Shell plc |
SHEL |
0.19 |
19.90% |
17.61% |
$42.31 |
|
TotalEnergies SE |
TTE |
0.31 |
33.80% |
16.01% |
$31.03 |
|
Peer Group Average |
0.30 |
27.09% |
22.36% |
$40.00 |
Source: Company Filings and Author Calculations
Capital Distributions Are Supported by Free Cash Flows
In the last five years, Equinor has grown free cash flow before capital distribution (FCF) from $5.8 billion in 2018 to $32.1 billion in 2022, compounding at 40.8% a year. Out of that, the company was able to raise dividend issuance from $$2.7 billion in 2018 to $5.4 billion in 2022, compounding at 14.87% a year. In addition, the firm was able to grow share buy-backs from nothing in 2018 to $3.3 billion in 2022. In 1Q23, the company earned $7.6 billion in FCF, paying out $2.9 billion in dividends and bought $500 million of their own shares. As the company’s profitability has increased, the cushion for expanding dividends and share buy-backs has dramatically increased. Since 2018, Equinor has generated a total of $80 billion in FCF, or 96% of its market cap! It has paid out $18.4 billion in dividends and bought-back $5.6 billion in shares, for a total of $24 billion in capital distributions, leaving a margin of $50 billion.
Source: Equinor ASA Filings and Author Calculations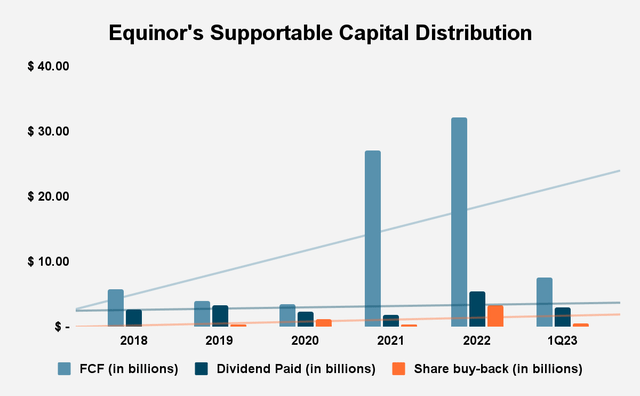
When you consider that half of management’s long-term executive compensation is tied to TSR, management has an incentive to increase dividends paid out and share buy-backs. Investors should then be more confident in Equinor’s ability to close the gap with stock market performance, and perhaps even exceed in the years ahead.
Valuation
Equinor has a price/earnings (P/E) multiple of 3.08 compared to a peer group average of 6.58 and an 8.01 P/E multiple for the MSCI World Energy Index, and 24.03 for the S&P 500. As we have seen, the company’s gross profitability, at 0.55, was higher than the 0.33 threshold for attractiveness, and higher than the 0.3 peer group average. Finally, the firm has an FCF yield of 17.94%, which is higher than the peer group average of 16.7% and the average FCF yield of the 2000 largest businesses in America, which New Constructs calculates at 2.7%. We have good reason to believe that Equinor’s performance in the next few years will outpace the market.
|
Company |
Gross Profitability |
P/E Ratio |
FCF Yield |
|
Equinor ASA |
0.55 |
3.08 |
17.94% |
|
BP plc |
0.27 |
4.40 |
27.01% |
|
Chevron Corp. |
0.28 |
8.35 |
12.73% |
|
ConocoPhillips Co. |
0.40 |
8.12 |
15.24% |
|
Eni SpA |
0.20 |
3.55 |
22.48% |
|
Exxon Mobil Corp. |
0.31 |
7.15 |
13.68% |
|
Repsol S.A. |
0.27 |
4.50 |
22.08% |
|
Shell plc |
0.19 |
4.84 |
23.71% |
|
TotalEnergies SE |
0.31 |
7.20 |
14.63% |
|
Peer Group Average |
0.30 |
6.58 |
16.70% |
Source: Company Filings
Conclusion
Equinor’s management has turned the business around since 2016, when shareholders voted to tie pay to relative TSR and relative ROACE. This gives managers an incentive for improving capital allocation, and increasing dividends and share repurchases. The business’s profitability has grown at an exceptional level, with the company towering over its peers in terms of gross profitability, ROIC, and operating margin. Equinor’s FCF generation has also grown at a dramatic rate, providing enormous support for dividends and share buy-backs. The company is trading at a low multiple, its profitability is attractive, and its FCF yield is market leading.
Read the full article here

