
By SchiffGold
Seasonally Adjusted Money Supply in April fell $167B. As the chart below shows, this is now the 9th consecutive monthly drop. This is also the second-largest drop of all time, behind only last month.
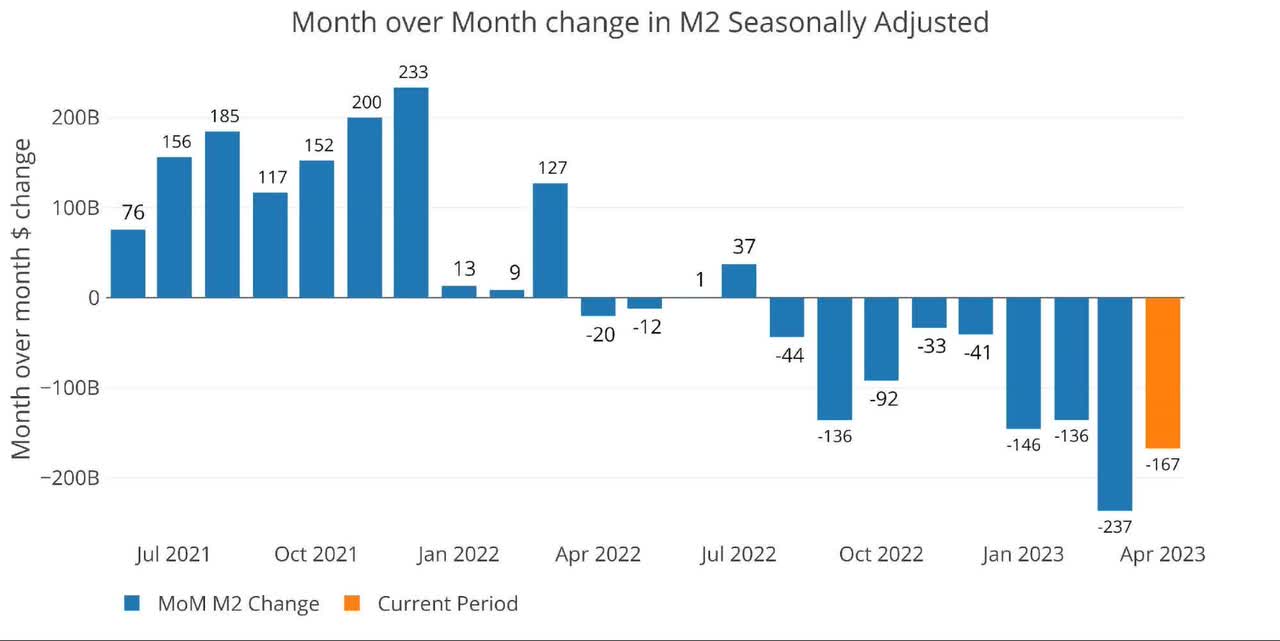
Figure 1: MoM M2 Change (Seasonally Adjusted)
Below are the unadjusted raw numbers which are slightly ahead of the adjusted numbers. The orange bar aligns with the same time period as the orange bar above.
April came in as a drop of $196B which is very close to the adjusted number. May is only showing one week so far but is already negative by $36B. At the same time last month, April was positive by $55B, so May could be setting up for another big drop.
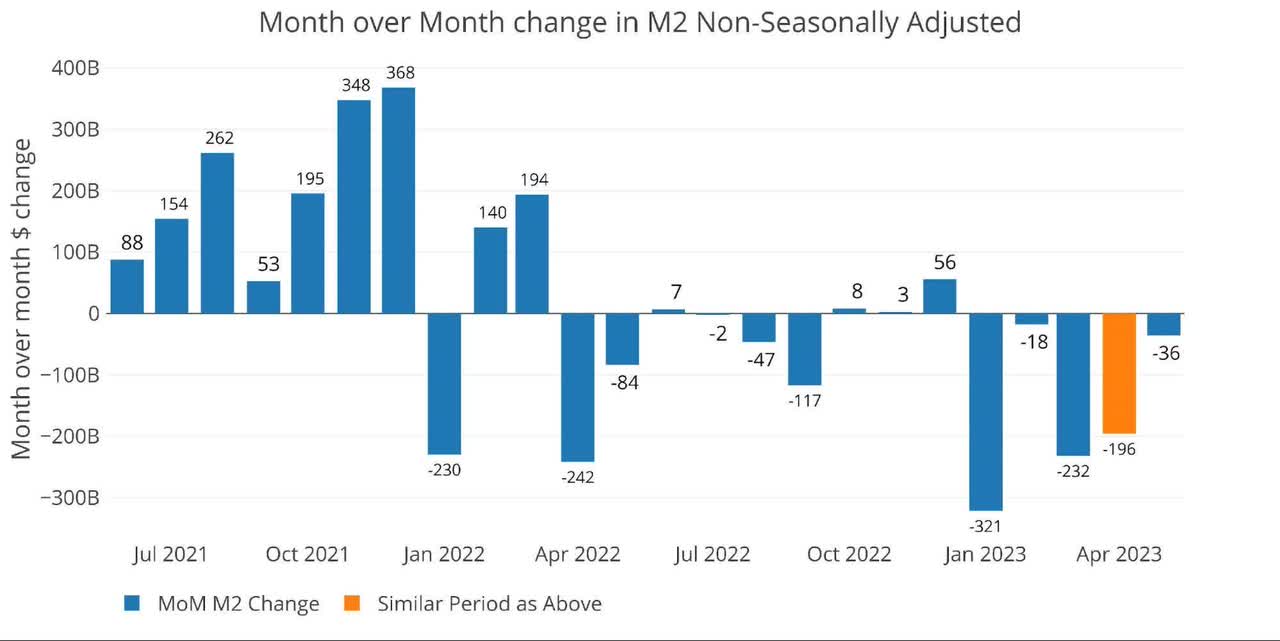
Figure 2: MoM M2 Change (Non-Seasonally Adjusted)
Looking at the seasonally adjusted numbers shows that this month decreased the Money Supply by -9.2% annualized which is below both the 6-month and 12-month trend (-7% and -4.6% respectively).
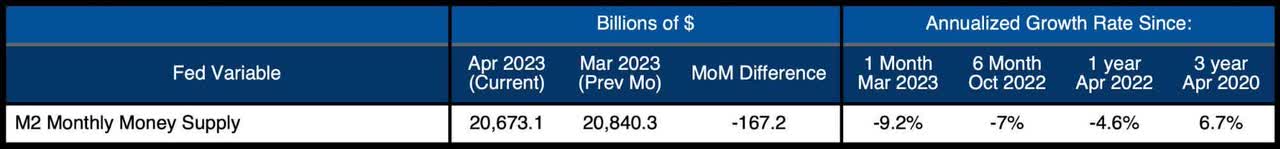
Figure 3: M2 Growth Rates
The average for March (pre-Covid) was 5.1%. Historical money supply was typically increasing at this time of year but is now dropping further into negative territory. This can be seen even more clearly by the next data set below: 13-week money supply.
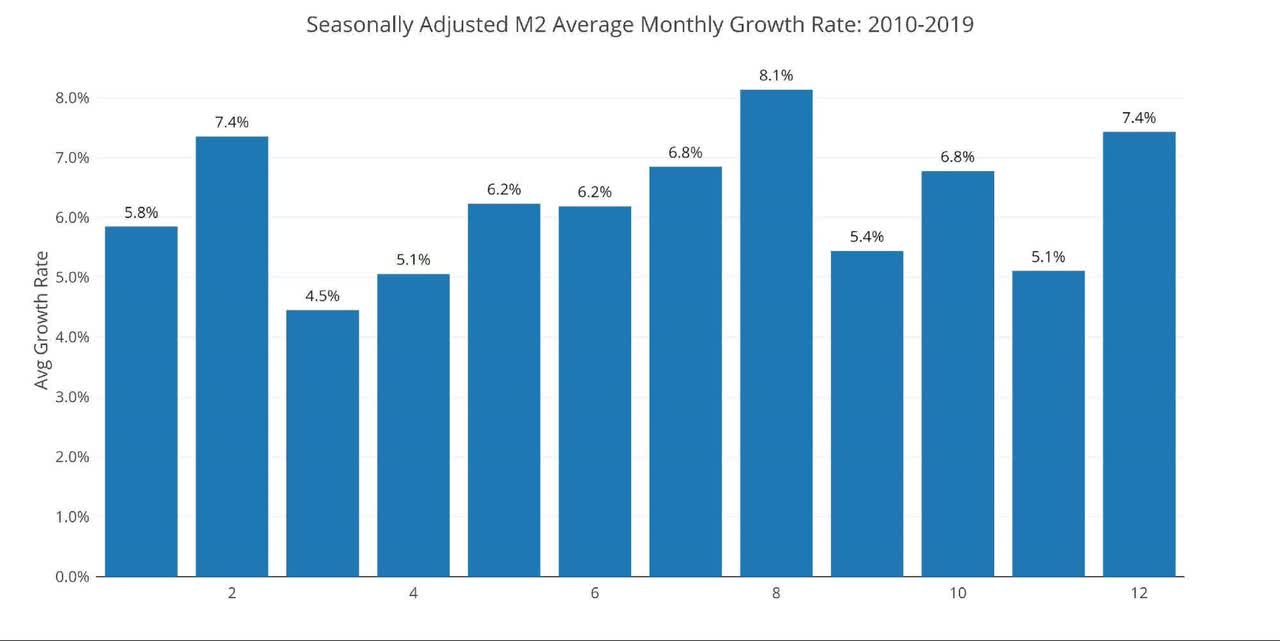
Figure 4: Average Monthly Growth Rates
First, it is interesting to see the weekly raw data shown below. The negative drops have gotten both larger and more frequent. This data is used to calculate the running 13-week money supply.
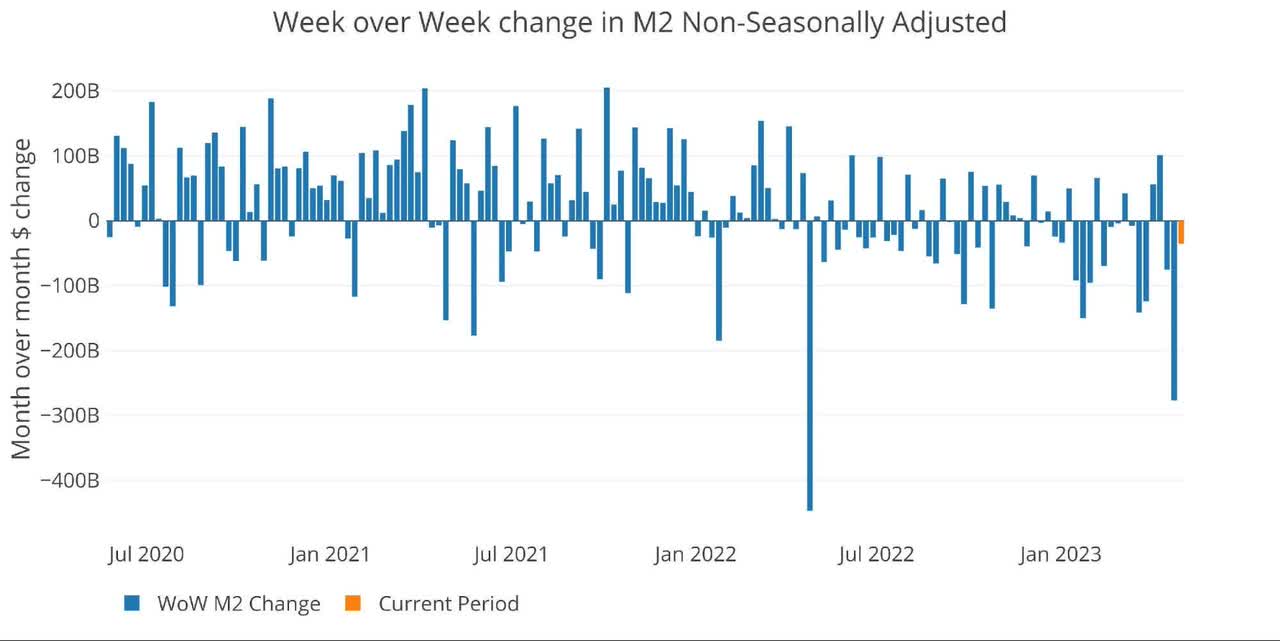
Figure 5: WoW M2 Change
The “Wenzel” 13-week Money Supply
The late Robert Wenzel of Economic Policy Journal used a modified calculation to track Money Supply. He used a trailing 13-week average growth rate annualized as defined in his book The Fed Flunks.
He specifically used the weekly data that was not seasonally adjusted. His analogy was that in order to know what to wear outside, he wants to know the current weather, not temperatures that have been averaged throughout the year.
The objective of the 13-week average is to smooth some of the choppy data without bringing in too much history that could blind someone from seeing what’s in front of them. The 13-week average growth rate can be seen in the table below. Decelerating trends are in red and accelerating trends in green.
The 13-week average has now reached a new all-time low of -7.2%. The growth rate has decelerated for 14 straight weeks and has remained negative for 45 weeks. This type of slowdown is completely unprecedented.
For almost a year, I have been flagging the massive drop in Money Supply. So far, only crypto and a few regional banks have been hit, but there is unquestionably a storm brewing.
This crash in money supply is way worse than what was seen in 2000 and 2008. With the market so much more dependent on cheap money now, it’s only a matter of time before something major breaks.
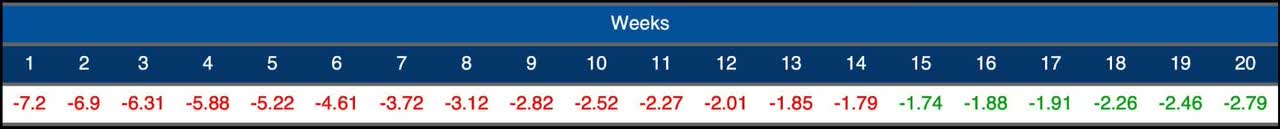


Figure 6: WoW Trailing 13-week Average Money Supply Growth
The plot below can really put the current drop into perspective. Seasonally, this is when Money Supply typically dips. If the historical trend holds, 13-week Money Supply could fall by another 3-6% before bottoming in August. This would bring the negative rate into double digits!
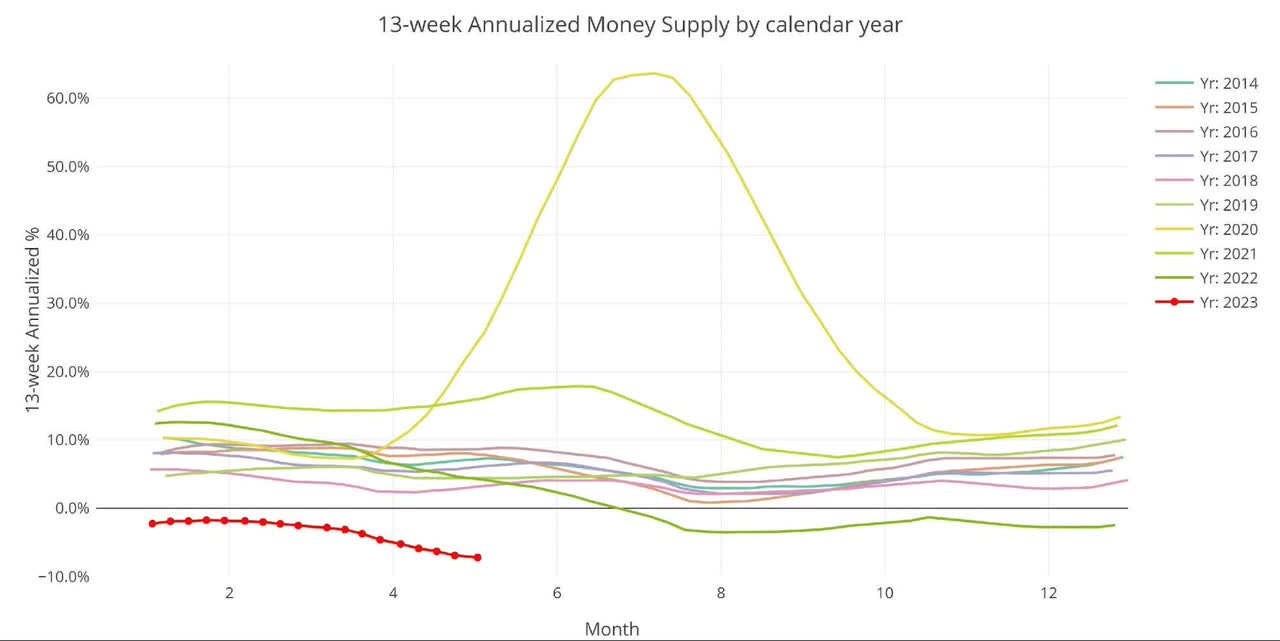
Figure 7: Yearly 13-week Overlay
Behind the Inflation Curve
Incredibly, even with the contracting Money Supply, the Fed is still not doing enough to solve the inflation problem. This is due to how much money was created over the last few years. Undoing this money creation would require an even bigger drop in Money Supply for an extended period.
The Fed will not make it that long.
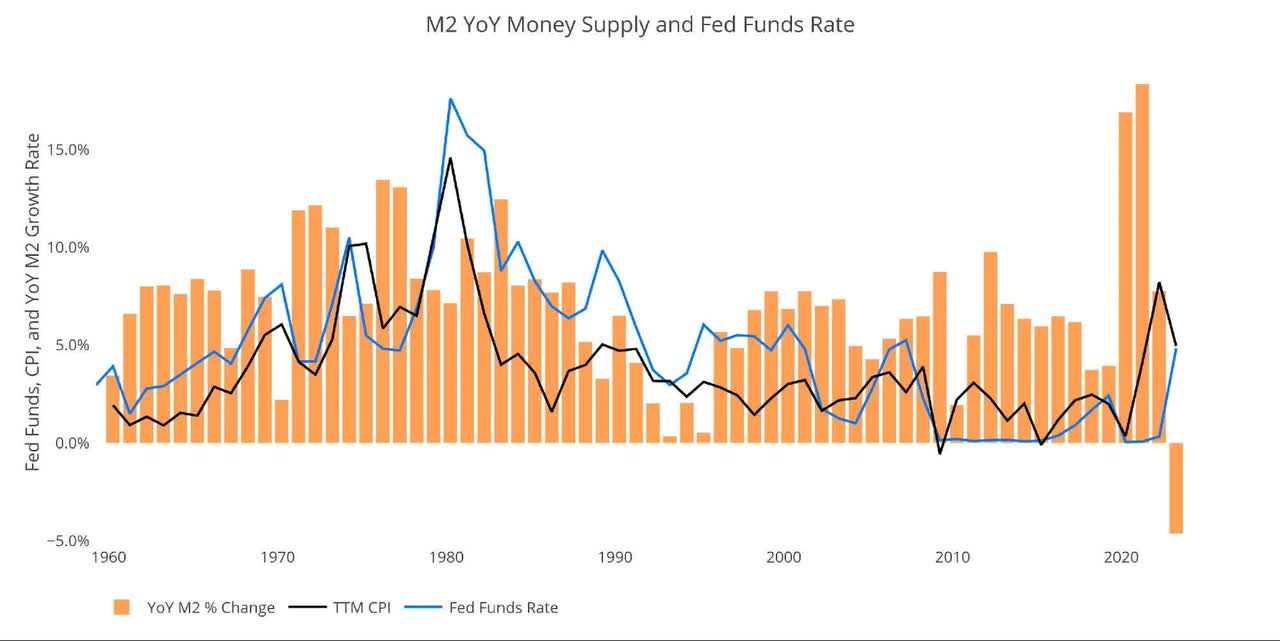
Figure 8: YoY M2 Change with CPI and Fed Funds
Historical Perspective
The charts below are designed to put the current trends into historical perspective. The orange bars represent annualized percentage change rather than raw dollar amount. The current slowdown can be seen clearly on the right side.
Despite the massive drop in Money Supply over recent months, it can still be put into context against what happened in 2020 and 2021. There is no question that the current drop in Money Supply will be unable to remove the inflation created during the pandemic. The drop will be enough to remove all support from the economy though.
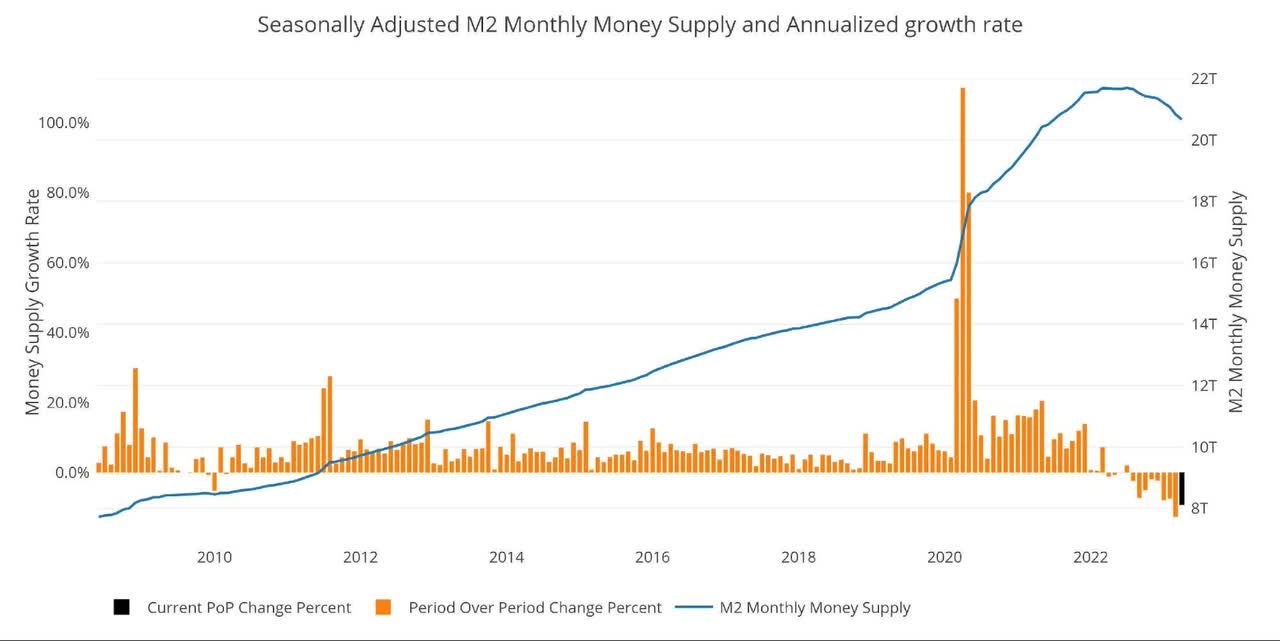
Figure 9: M2 with Growth Rate
Taking a historical look at the 13-week annualized average also shows the current predicament. This chart overlays the log return of the S&P. Mr. Wenzel proposed that large drops in Money Supply could be a sign of stock market pullbacks.
His theory, derived from Murray Rothbard, states that when the market experiences a shrinking growth rate of Money Supply (or even negative) it can create liquidity issues in the stock market, leading to a sell off.
While not a perfect predictive tool, many of the dips in Money Supply precede market dips. Specifically, the major dips in 2002 and 2008 from +10% down to 0%. The economy is now grappling with a peak growth rate of 63.7% in July 2020 crashing to deep negative rates only a few years later.
The effects of this move will be felt sooner rather than later.
Please note the chart only shows market data through May 1st to align with available M2 data.
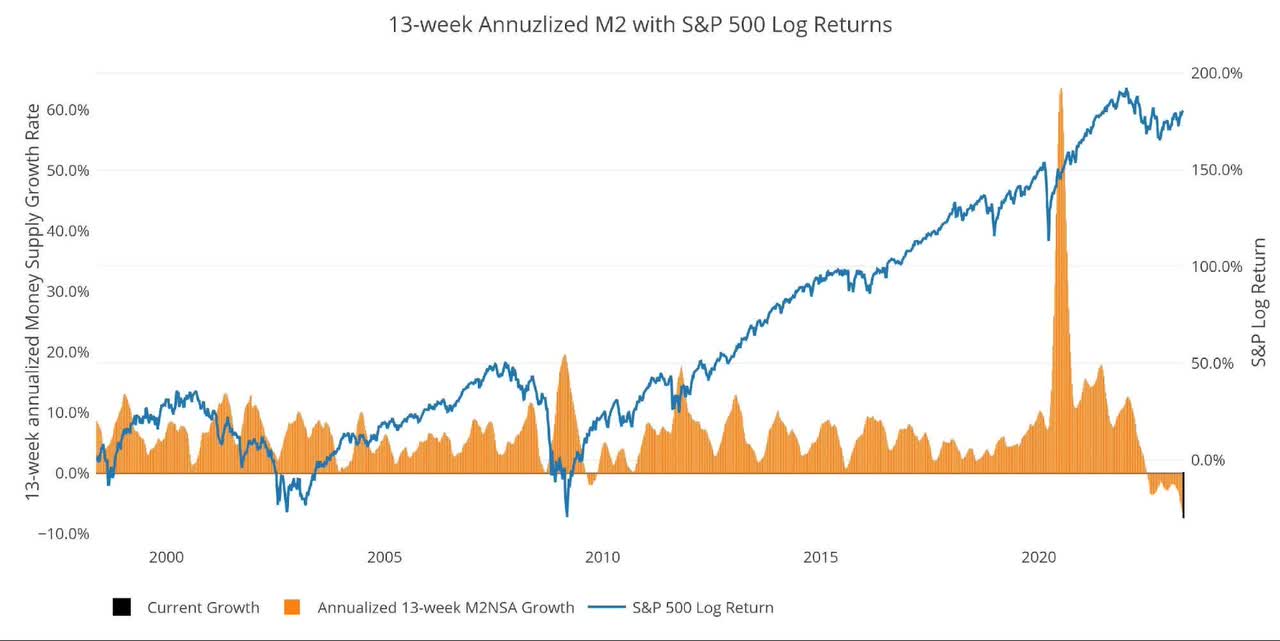
Figure 10: 13-week M2 Annualized and S&P 500
One other consideration is the massive buildup in the reverse repo market at the Fed. This is a tool that allows financial institutions to swap cash for instruments on the Fed balance sheet.
Current Reverse Repos peaked at $2.55T on Dec 30. This broke the previous record from September. The value typically tops out at quarter-end. This past March 31st, the value topped out at $2.37T which was a bit shy of the December record. The value currently sits at $2.27B.
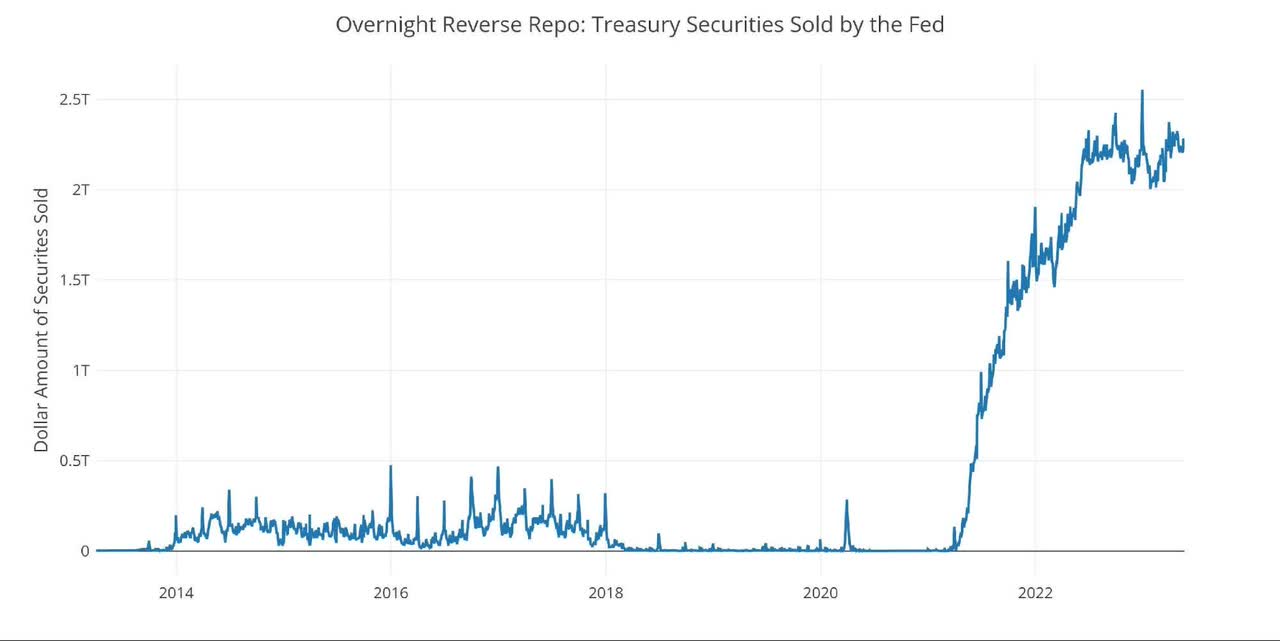
Figure 11: Fed Reverse Repurchase Agreements
Wrapping Up
I may sound like a broken record, but the Fed has done more than enough already to crash the economy… it’s just a waiting game at this point. There is no way an economy this addicted to cheap money, which also received an extra massive dose in 2020 (see Figure 5 above), can survive with Money Supply continuing to shrink at current rates. The economy needs more cheap money to keep going.
These events take time to play out, but it then also takes time for any rescue policy to have its effect. The Fed is about to learn this firsthand. Once they are forced to cut, they will find out that all of their policy works on a lag. Cuts will do little to blunt the upcoming crisis. This will force them to move to the other extreme and ignite the fires of inflation once again.
It’s best to get prepared before that happens!
Data Source: M2 and also series WM2NS and RRPONTSYD. Historical data changes over time so numbers of future articles may not match exactly. M1 is not used because the calculation was recently changed and backdated to March 2020, distorting the graph.
Data Updated: Monthly on fourth Tuesday of the month on 3-week lag
Most recent data: May 01, 2023
Interactive charts and graphs can always be found on the Exploring Finance dashboard: US Debt Analysis
Original Post
Editor’s Note: The summary bullets for this article were chosen by Seeking Alpha editors.
Read the full article here

