Introduction
Toronto-based Barrick Gold (NYSE:GOLD) released its first quarter 2023 results on May 3, 2023.
Note: This article updates my February 16, 2022, article. I have followed GOLD on Seeking Alpha since April 2015.
1 – 1Q23 Results Snapshot
GOLD 1Q23 Highlights Presentation (GOLD Presentation)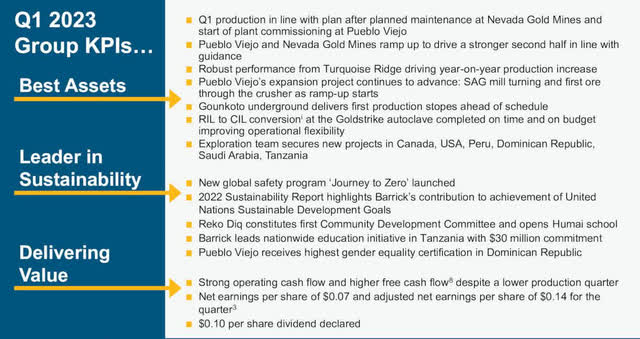
Barrick reported a net earnings income of $120 million or $0.07 per diluted share in 1Q23, down from $438 million or $0.25 in the year-ago quarter.
Production for the first quarter was 952K oz (sold 954K oz) of gold and 88 Mlbs of Copper (sold 89 Moz). Copper production decreased 12.9% year over year. The average realized copper price was $3.40, down 24.9% YoY.
The company is on track to achieve 2023 Guidance of 4.2 to 4.6 Moz of Gold and 420 to 470 Mlb of Copper, with a strong performance expected in H2 2023.
GOLD 1Q23 achievement (GOLD Presentation)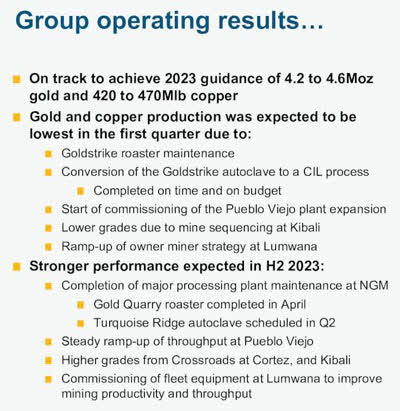
The average market price for gold in 1Q23 was $1,902 per ounce, up from $1,876 in 1Q22. Production was particularly weak this quarter.
GOLD Production comparison per mine 4Q22 versus 1Q23 (Fun Trading)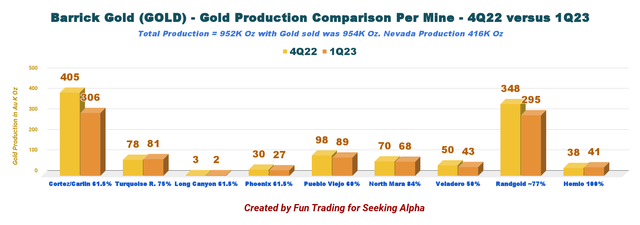
2 – Stock performance
Barrick Gold is one of the three gold miners that I consider my core long-term “gold miners,” together with Newmont (NEM) and Agnico Eagle (AEM).
GOLD is down 10% in one year. However, NEM is lagging and is down 31% on a one-year basis. We can see below that Barrick is underperforming Agnico Eagle.
Note: I recommend reading my recent article on AEM by clicking here.
GOLD Chart comparison: GOLD, AEM, NEM (Fun Trading)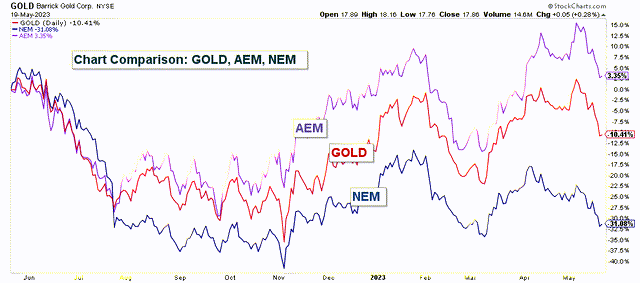
3 – Investment thesis
The investment thesis has not changed for many years, and I still recommend keeping a long-term GOLD core position. For years, Agnico Eagle, Newmont Corporation, and Barrick Gold Corporation have been my preferred long gold miners.
GOLD is highly correlated to the gold price, even if the company produces a significant Copper amount.
Gold has turned bullish since March and recently reached nearly $2,050 per ounce but has since retraced to $1,978 per ounce, which is still a solid price for the industry.
Initially, the market expected the FED to consider lowering interest rates at the end of 2023, which boosted the gold price in April. However, the market is now reconsidering this first bullish assumption, weakening Gold in the process.
Still, Gold and Silver’s prices are up 10% and 8% YoY, whereas Copper continues to underperform.
GOLD 1-Year Chart Gold, Silver, Copper (Fun Trading StockCharts)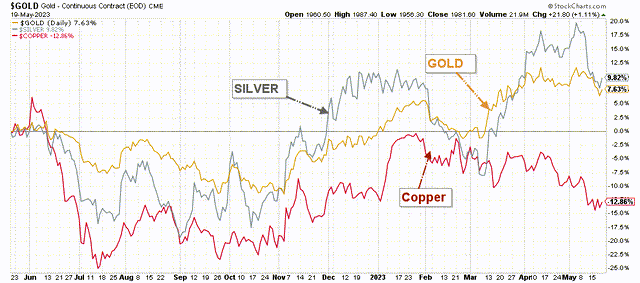
Thus, because of the wild fluctuations in the price of gold, I recommend trading short-term LIFO at a minimum of 40% of your GOLD position. I believe it is crucial and will help you to reduce the risk and increase your return significantly.
CEO Mark Bristow said in the conference call:
Despite the lower production, our high quality asset portfolio increased free cash flow and allowed us to maintain a $0.10 quarterly dividend in line with our performance dividend policy.
Barrick Gold – Balance Sheet History until 1Q23 and Production Data: The Raw Numbers
| Barrick Gold | 1Q22 | 2Q22 | 3Q22 | 4Q22 | 1Q23 |
| Total Revenues in $ billion | 2.853 | 2.859 | 2.527 | 2.774 | 2,643 |
| Net Income in $ billion | 0.438 | 0.488 | 241 | -735 | 120 |
| EBITDA $ billion | 1.553 | 1.557 | 1.169 | -194 | 1,088 |
| EPS diluted in $/share | 0.25 | 0.27 | 0.14 | -0.42 | 0.07 |
| Cash from operations in $ million | 1.004 | 0.924 | 0.758 | 0.795 | 0.776 |
| Capital Expenditure in $ million | 611 | 755 | 0.792 | 0.891 | 0.688 |
| Free Cash Flow in $ million | 393 | 169 | -34 | -96 | 88 |
| Total cash $ billion | 5.89 | 5.78 | 5.24 | 4.44 | 4.38 |
| Long-term Debt in $ billion | 5.14 | 5.14 | 5.10 | 4.78 | 4.78 |
| Dividend per share in $ | 0.20 | 0.20 | 0.15 | 0.10 | 0.10 |
| Shares outstanding (diluted) in billion | 1.779 | 1.777 | 1.768 | 1.759 | 1.755 |
| Gold Production | 1Q22 | 2Q22 | 3Q22 | 4Q22 | 1Q23 |
| Gold Production K Oz | 990 | 1,043 | 988 | 1,120 | 952 |
| Copper Production Mlbs | 101 | 120 | 123 | 96 | 88 |
| AISC $/Oz by-product | 1,164 | 1,212 | 1,269 | 1,242 | 1,370 |
| Gold price realized $/Oz | 1,876 | 1,871 | 1,722 | 1,728 | 1,902 |
Data Source: Company press release
Part I – Barrick Gold – Balance Sheet Analysis
1 – Revenue details. GOLD earned $2.643 billion in 1Q23
GOLD Quarterly Revenue History (Fun Trading)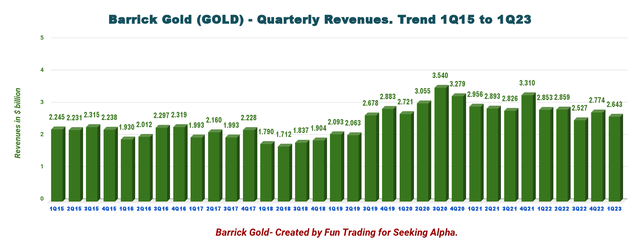
Barrick reported its first quarter 2023 results on May 3, 2023. Barrick recorded total sales of $2,643 million, down 7.4% year-over-year.
The company’s net income was $120 million, or $0.07 per diluted share, in the first quarter of 2023, compared to an income of $438 million, or $0.25 per share, in the year-ago quarter.
After adjusting for items not indicative of future operating earnings, adjusted net earnings were $247 million.
Net cash from operating activities decreased 22.7% year-over-year to $776 million compared to $1,004 million a year ago, with a gold price reaching $1,902 per ounce this quarter.
2 – Free cash flow was a loss of $88 million in 1Q23
GOLD Quarterly Free Cash Flow History (Fun Trading)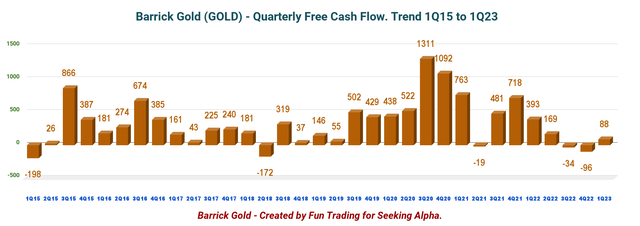
Note: The generic free cash flow is the cash from operations minus CapEx.
The free cash flow for the quarter was $88 million, and the trailing 12-month free cash flow is $127 million, which covers the dividend payout.
Barrick Gold declared a quarterly dividend of $0.10 per share, consistent with the company’s dividend policy. It is a dividend yield of 2.24%. In the press release:
At the February 14, 2023 meeting, the Board of Directors authorized a new share buyback program for the repurchase of up to $1.0 billion of the Company’s outstanding common shares over the next 12 months. During the three months ended March 31, 2023, Barrick did not purchase any shares under this program.
3 – Net debt was $400 million, and cash on hand of $4,377 million in 1Q23
GOLD Quarterly Debt versus Cash History (Fun Trading)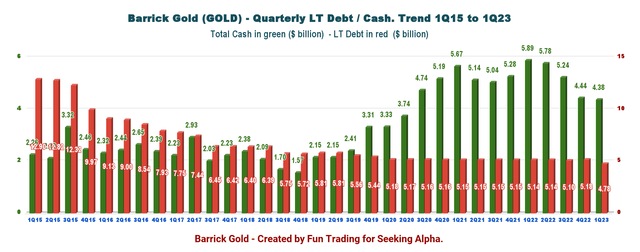
Total debt was down to $4,777 million at the end of the first quarter, and the total cash was $4,377 million. The company has an excellent debt position. GOLD’s debt-to-equity ratio was 0.15:1 in 1Q23. Furthermore, GOLD indicated in the M&A report:
For the remainder of 2023, we have contractual obligations and commitments of $658 million for supplies and consumables. In addition, we have $271 million in interest payments and other amounts. We expect to fund these commitments through operating cash flow, which is our primary source of liquidity, as well as our existing cash balances as necessary.
Part II – 4Q22 Gold Production and Commentary
The company reported fourth-quarter production for gold of 952K Au ounces (sold 954K Oz) and 88M Cu Lbs (sold 89M Cu Lbs). Production was particularly weak this quarter but still in line with expectations.
President and chief executive Mark Bristow said in the press release:
Production, while lower than Q4 2022, was on plan, and free cash flow had still increased, demonstrating the value of Barrick’s Tier One asset portfolio.
The average price for gold in the first quarter was $1,902 per ounce, while the average copper price was $3.40 per pound. AISC was high this quarter at $1,370 per ounce.
1 – Gold production details and historical charts
1Q23 production was in line with planning after planned maintenance at Nevada Gold Mines and the start of plant commissioning at Pueblo Viejo. However, it was a multi-year low, as shown below:
GOLD Quarterly Production History (Fun Trading)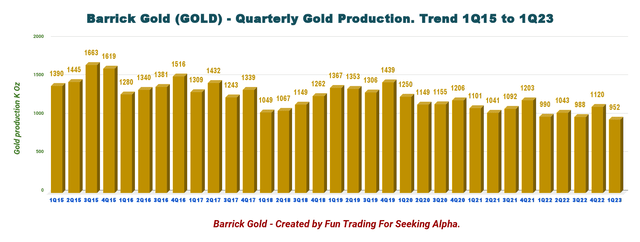
Below is shown production per mine.
Note: JV Nevada represents five gold mines: Cortez, Carlin, Turquoise, Long Canyon, and Phoenix. Also, Randgold represents four mines: Loulo-Gounkoto, Kibali, Tongon, and Bulyanhulu.
GOLD 1Q23 gold production per mine (Fun Trading)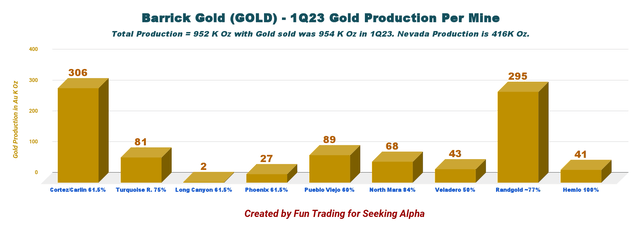
2 – Copper production per mine and quarter ending the first quarter of 2023
GOLD Copper production per mine History (Fun Trading)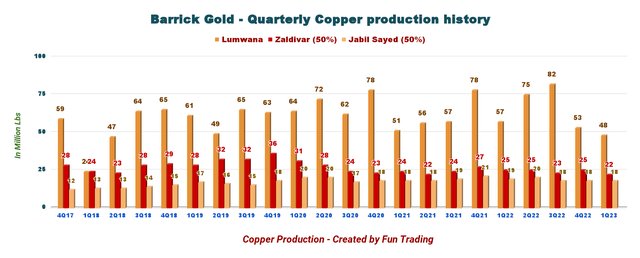
1Q23 copper production was low with 88 Mlbs and sold 89 Mlbs.
3 – Gold and copper prices realized
The average market price for gold in the second quarter was a solid $1,902 per ounce and $3.40 per pound for copper.
3.1 – Gold price history
GOLD Quarterly Gold Price Realized History (Fun Trading)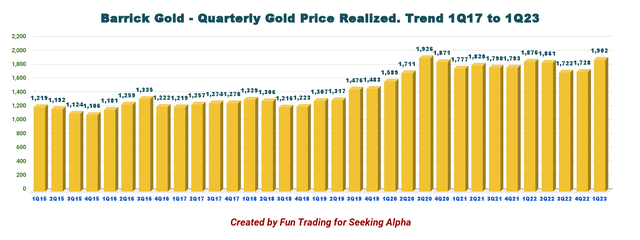
The gold price realized was $1,902 per ounce in 1Q23, up from a solid $1,876 last year.
3.2 – Copper price realized will be lower this quarter
GOLD Quarterly Copper price realized History (Fun Trading)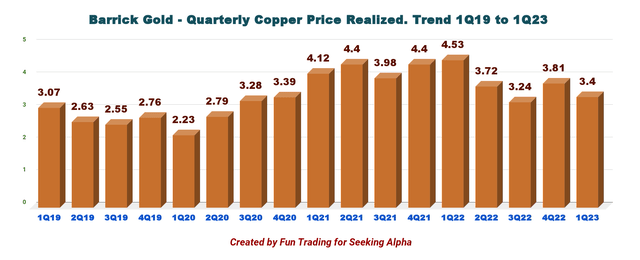
Unfortunately, the copper price received by Barrick fell YoY. The copper price in the first quarter of 2023 was 24.9% lower YoY. The average market price for copper in 1Q23 was $3.40 per pound.
The copper price is directly correlated to China’s economy. A majority of analysts are bullish for 2023-2024. However, I would take that with a grain of salt.
Despite the recent pullback in copper prices, we expect the copper price forecast to experience higher highs and lows in the near term, partially due to the recovery of China’s base metals import market.
4 – In April, Barrick started Plan Commissioning at Pueblo Viejo
CEO Mark Bristow said in the conference call:
The new plant was more than 90% complete at the end of the quarter. And we’ve started an aggressive commissioning program in April, targeted to be complete — fully complete, in line with our plan during July.
The project will extend Pueblo Viejo’s Tier One life by at least 20 years at an average annual production rate of more than 800,000 ounces per year. And its success is attributed to the partnership between management, our host country and the surrounding communities.
Part III – Technical Analysis and Commentary
GOLD TA Chart Short-Term (Fun Trading StockCharts)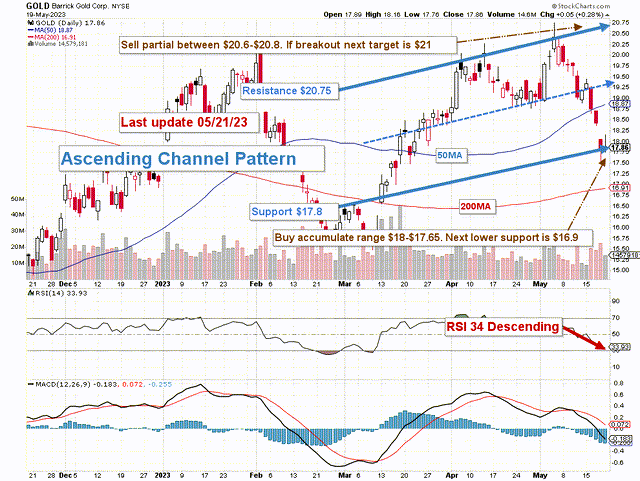
Note: The chart is adjusted for the dividend.
GOLD forms an ascending channel pattern, with resistance at $20.75 and support at $17.8. RSI (14) starts to be oversold at 34, indicating that we may be about to reach support.
Ascending channel patterns or rising channels are short-term bullish in that a stock moves higher within an ascending channel, but these patterns often form within longer-term downtrends as continuation patterns. The ascending channel pattern is often followed by lower prices
The overall strategy that I encourage in my marketplace, “The Gold And Oil Corner,” is to keep a core long-term position and use about 40% to trade LIFO while waiting for a higher final price target for your core position between $23 and $25 and pocketing the dividend in the meantime.
The trading strategy is to sell between $20.6 and $20.8, with possibly higher resistance at $21. I suggest accumulating between $18 and $17.65, with lower potential support at $16.9.
Watch the gold price like a hawk.
Warning: The TA chart must be updated frequently to be relevant. It is what I am doing in my stock tracker. The chart above has a possible validity of about a week or two. Remember, the TA chart is a tool only to help you adopt the right strategy. It is not a way to foresee the future. No one and nothing can.
Read the full article here

