
The current economic and investing environment remains one of the most challenging and difficult to navigate in recent times. We have stubborn inflation, economic resilience, geopolitical tensions, tight labour markets, rising interest rates, higher for longer monetary policy, QT, bank failures, overwhelming bearishness, and now, issues surrounding the debt ceiling. There’s a bit of something for everyone.
Through 40+ charts and in a simple yet (hopefully) insightful manner, this article will attempt to act as your all-encompassing guide through this challenging environment.
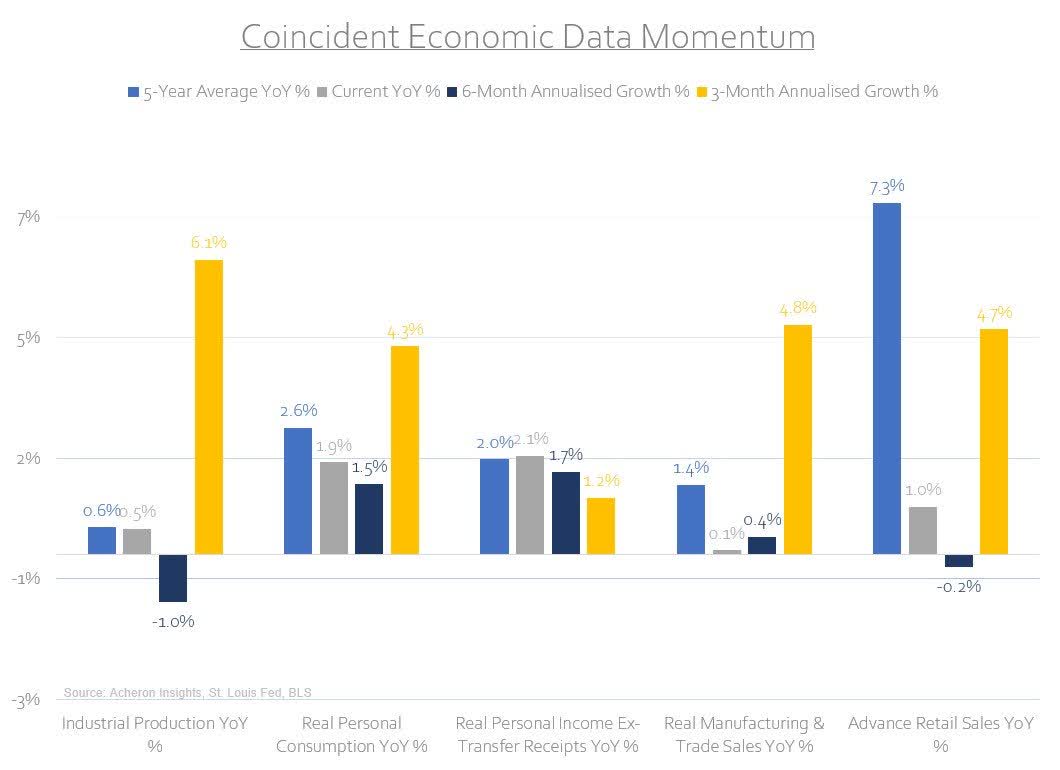
Beginning with the US economy, despite some signs of economic deterioration of late, coincident economic data points remain resilient. Indeed, economic momentum refuses to capitulate despite the leading indicators suggesting it should. Looking at the annualised growth rates of the past three months for a variety of coincident data points such as industrial production, real personal consumption, real manufacturing and trade sales, and retail sales, the US economy has had an excellent start to the year.
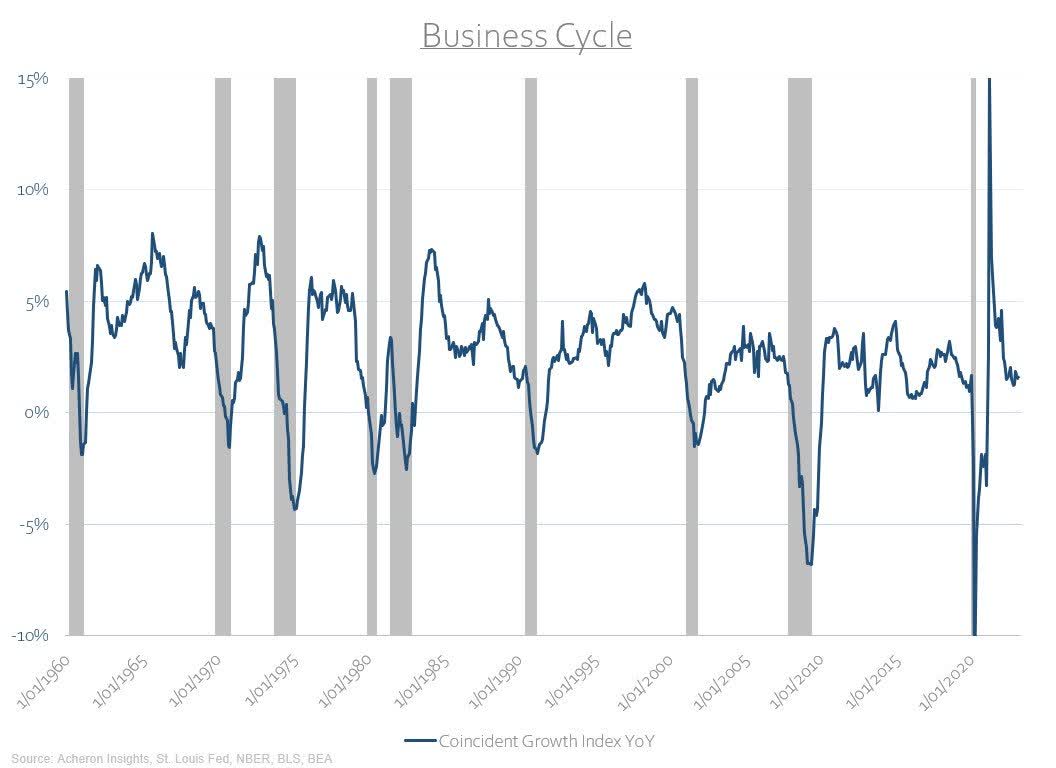
My business cycle index also continues to hold up. Similar to the above, this model takes coincident data from all corners of the economy and attempts to capture the overall trend in growth, and although the trend is down, history suggests we need to see this index cross into negative territory in order for the economy to be in recession. This may be where we end up, but we aren’t there yet.
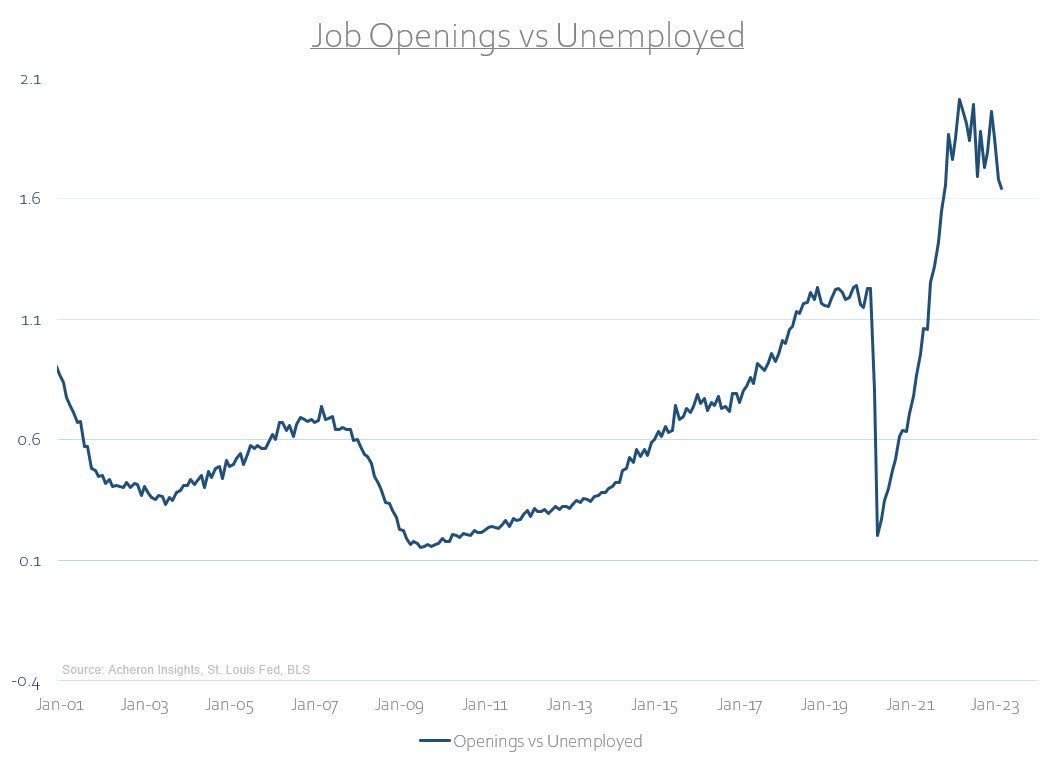
The services sector and the labour market remain particularly strong. Although the labour market itself is a lagging indicator, it remains historically tight. A chart as simple as this goes a long way in explaining why the Fed is doing what they’re doing.
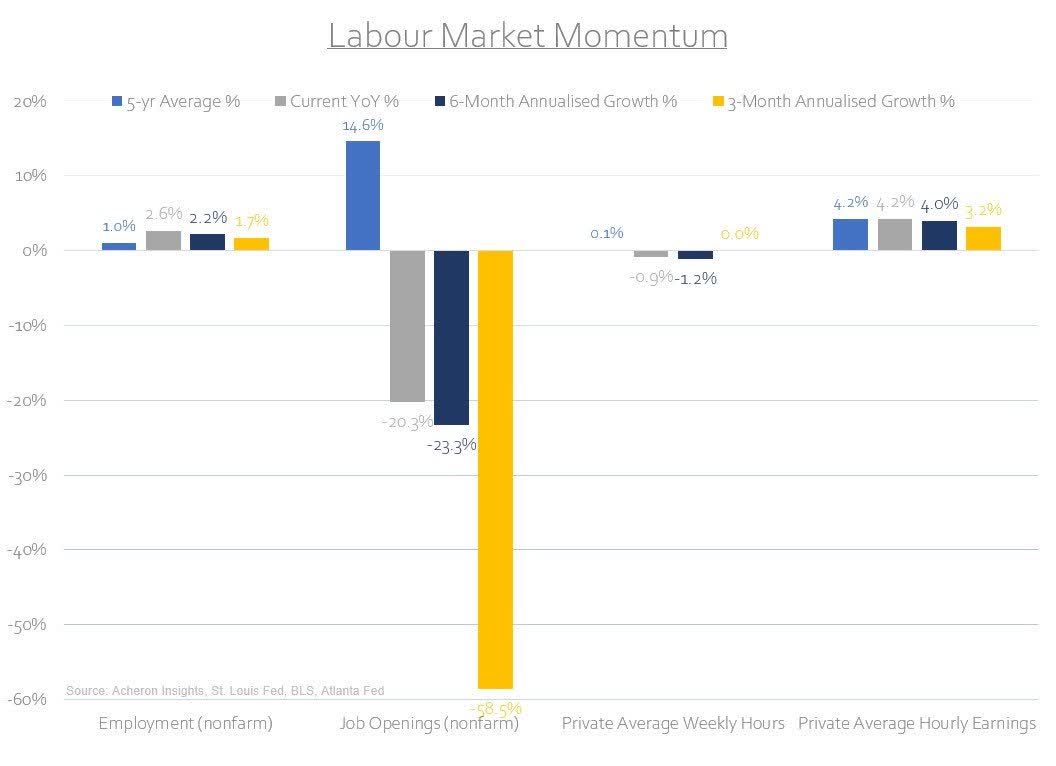
However, you’d be hard-pressed to argue both wages and employment have not already peaked for this cycle. The leading indicators of both have been signalling for some time that wage growth and employment should begin to roll over as 2023 progresses. Examining the momentum of several key labour market data points we can see this does look to be the case, with job openings now growing at a three-month annualised rate of -58%!
In terms of inflation, progress to the downside continues to be made. Headline inflation is now 4% below its cycle highs.
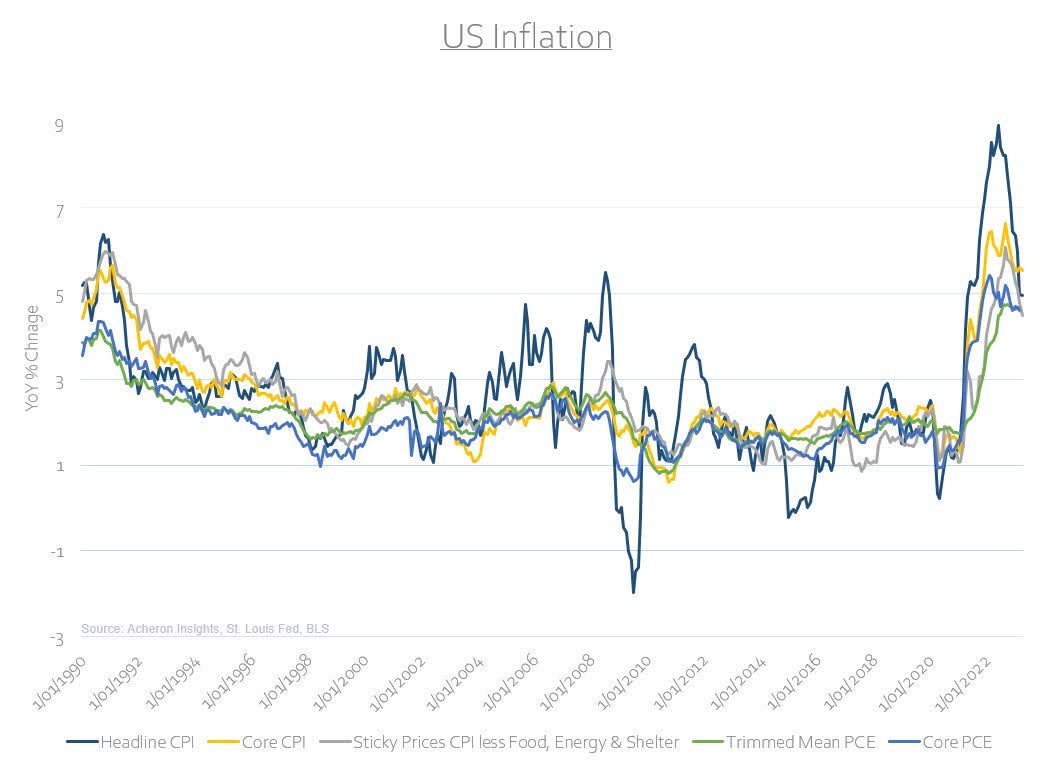
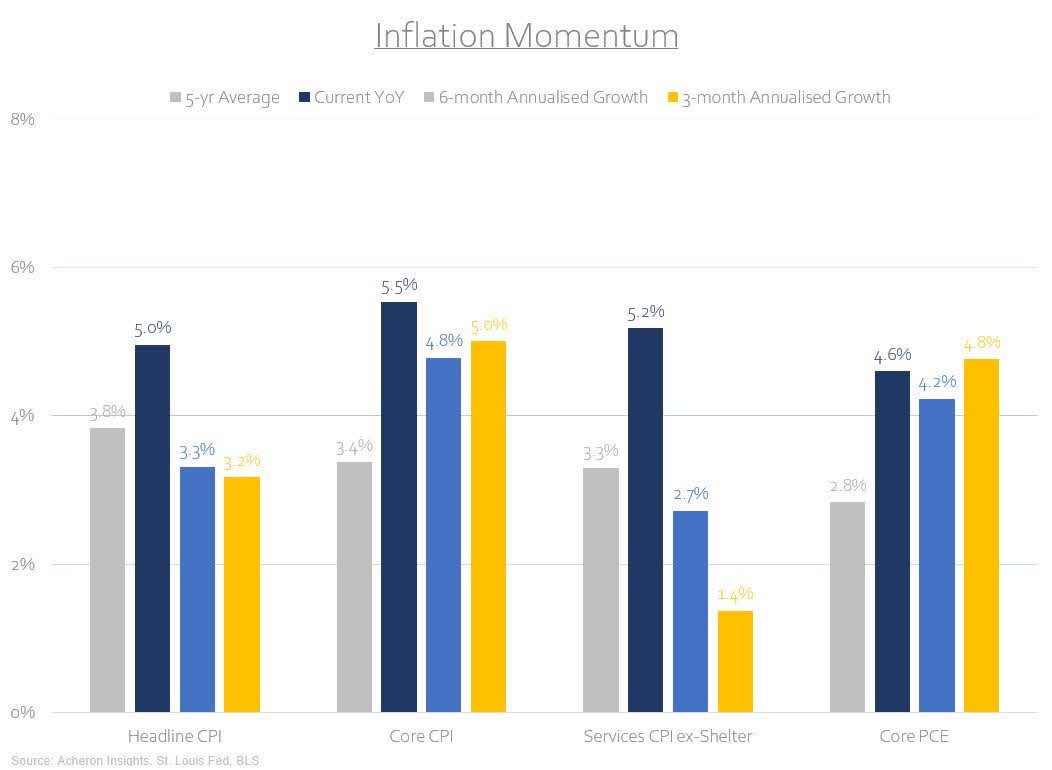
Inflation momentum continues to wane. Nowhere is this more prominent than the services ex-shelter CPI reading, which itself is now growing at a three-month annualised rate of just 1.4%, well below the Fed’s 2% target. Meanwhile, food, energy, and goods inflation should continue to drift lower in the months ahead.
CPI is now being held up almost entirely by the shelter component. Unfortunately, shelter CPI makes up roughly 34% of headline CPI.
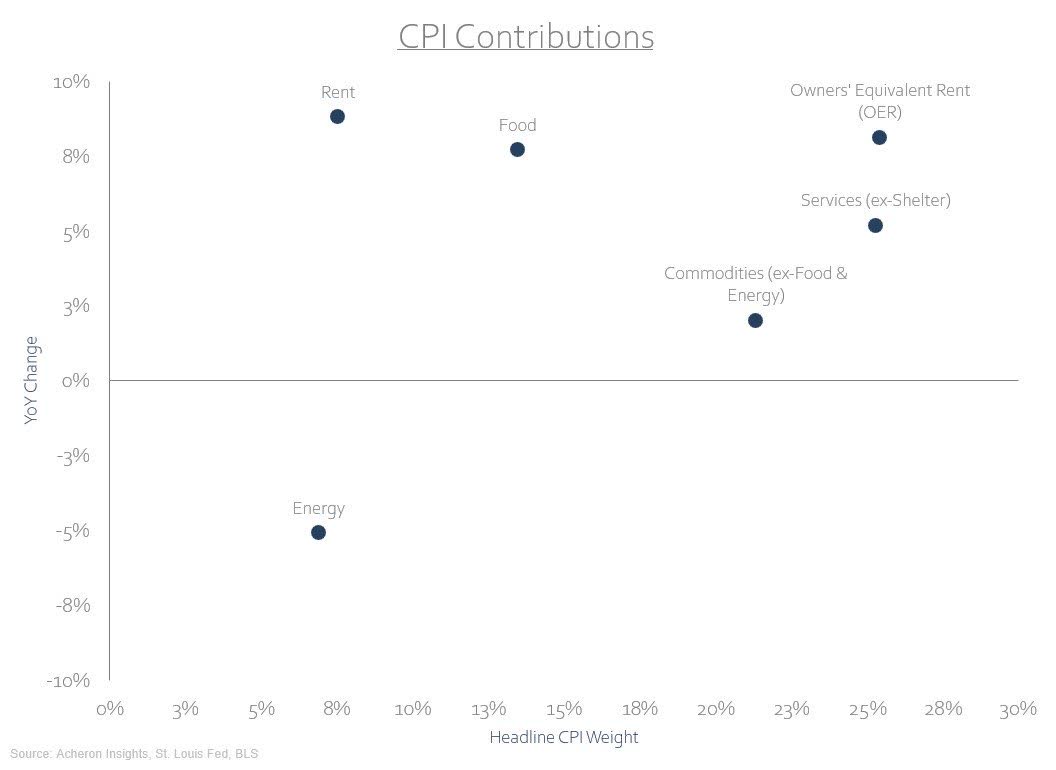
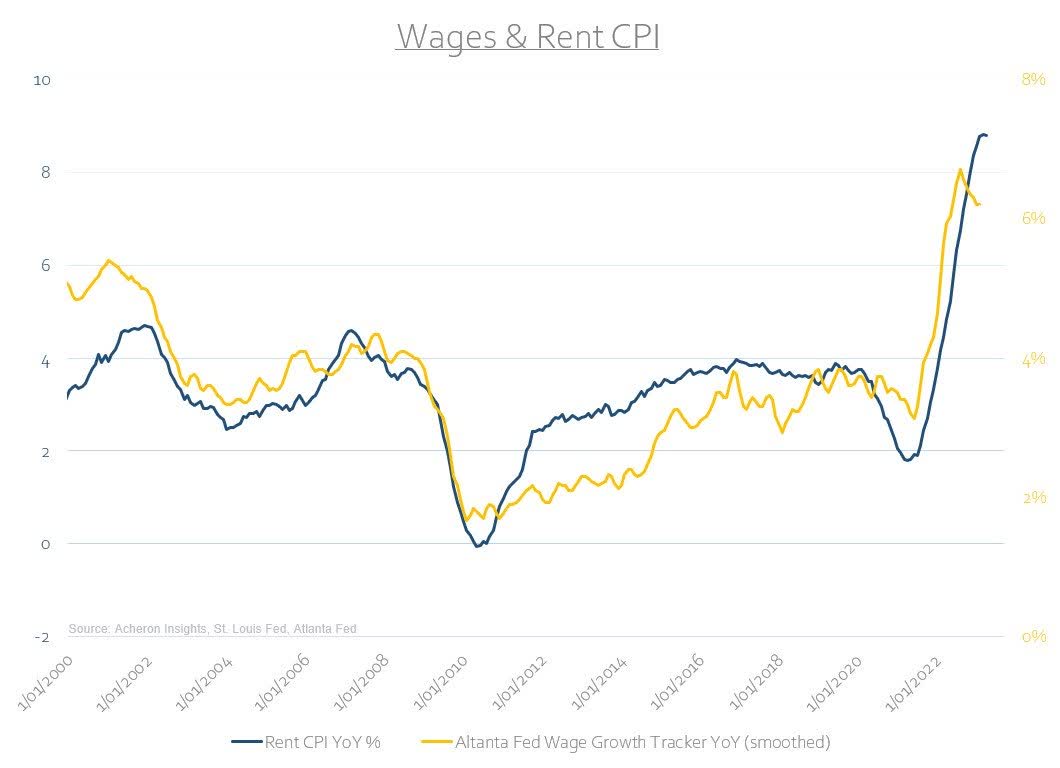
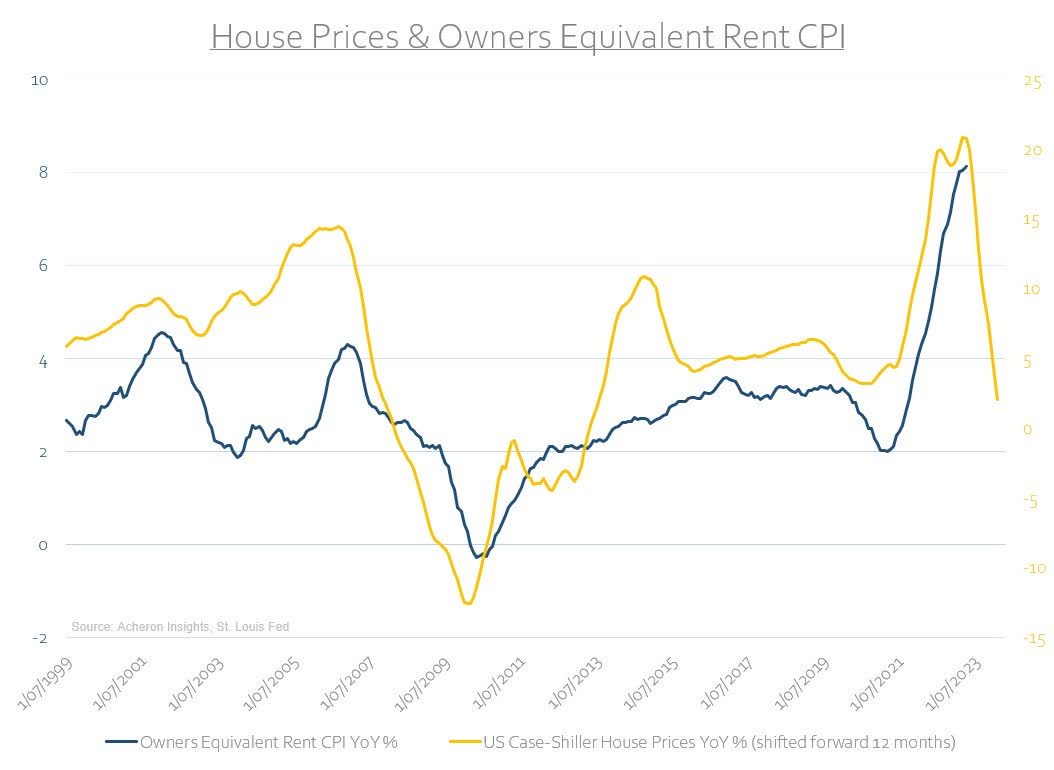
Shelter CPI consists of both rent CPI and owners’ equivalent rent (OER) CPI. The former (roughly 8% of headline CPI) is still being held up by wages (for now). As wage growth begins to cool, upside pressures on rent CPI will also come off, though I suspect they will remain sticky for some time still.
OER (roughly 25% of headline CPI) on the other hand, is being held up by house price appreciation (again, for now). Given the recent trajectory in house prices, owners’ equivalent rent will become a notable disinflationary force at some point in late 2023 and into 2024.
In terms of the outlook for the business cycle, despite the aforementioned economic resilience the forward-looking indicators for economic growth continue to suggest recessionary conditions are forthcoming. This could be anywhere from Q3 2023 to Q1 2024 (if not later).
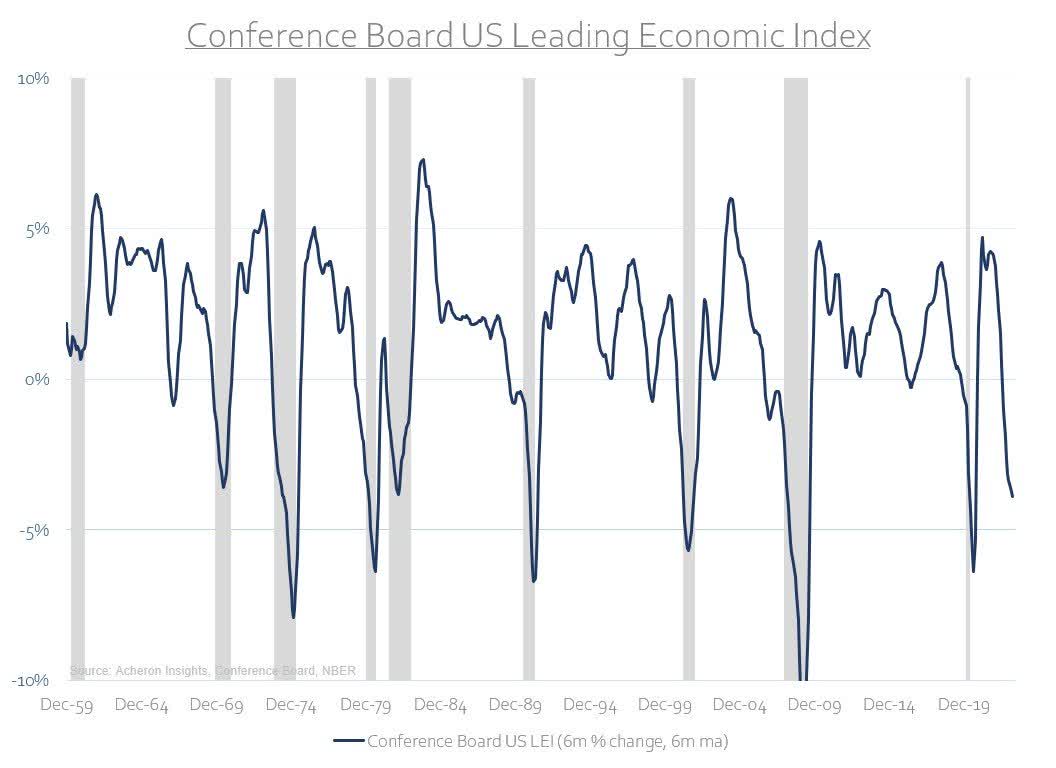
If we were to go by the Conference Board’s Leading Economic Index, one could easily make the case we are already in recession. While there is a good chance this will eventuate, it must be said this index is being skewed to the downside due to its reliance on soft data and survey inputs, which themselves are being biased lower due to inflation.
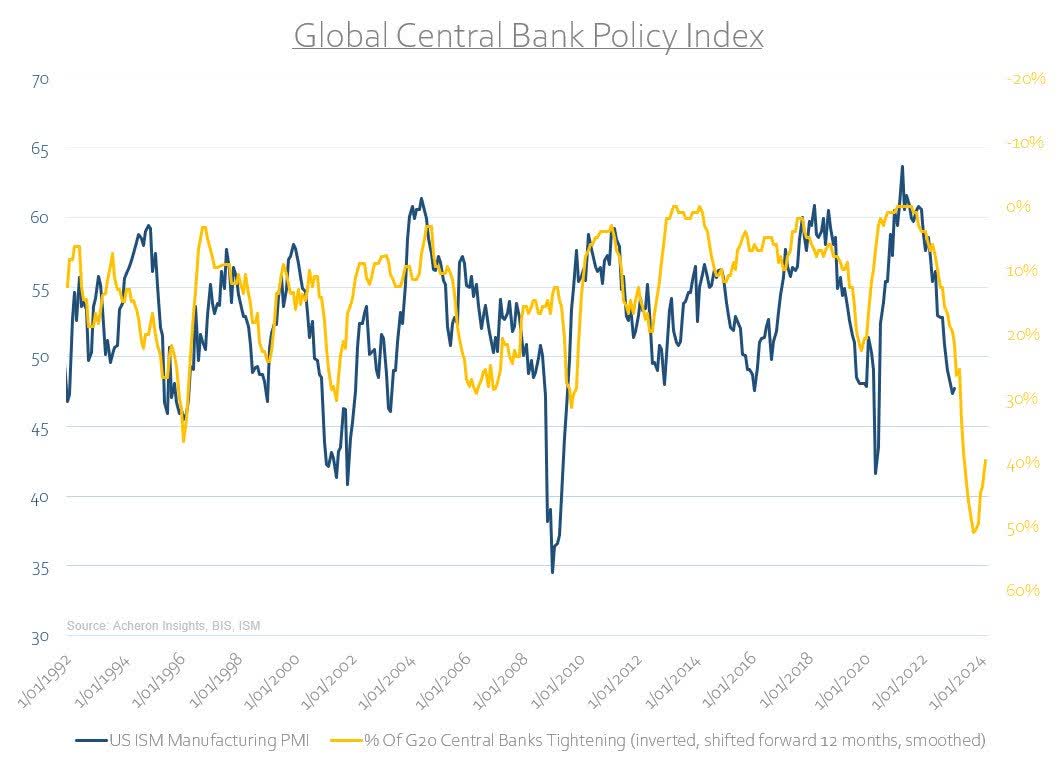
Regardless, a hard landing is certainly in play. The monetary policy lags are long and variable, and central bank policy conditions worldwide remain near their most restrictive level in recent history.
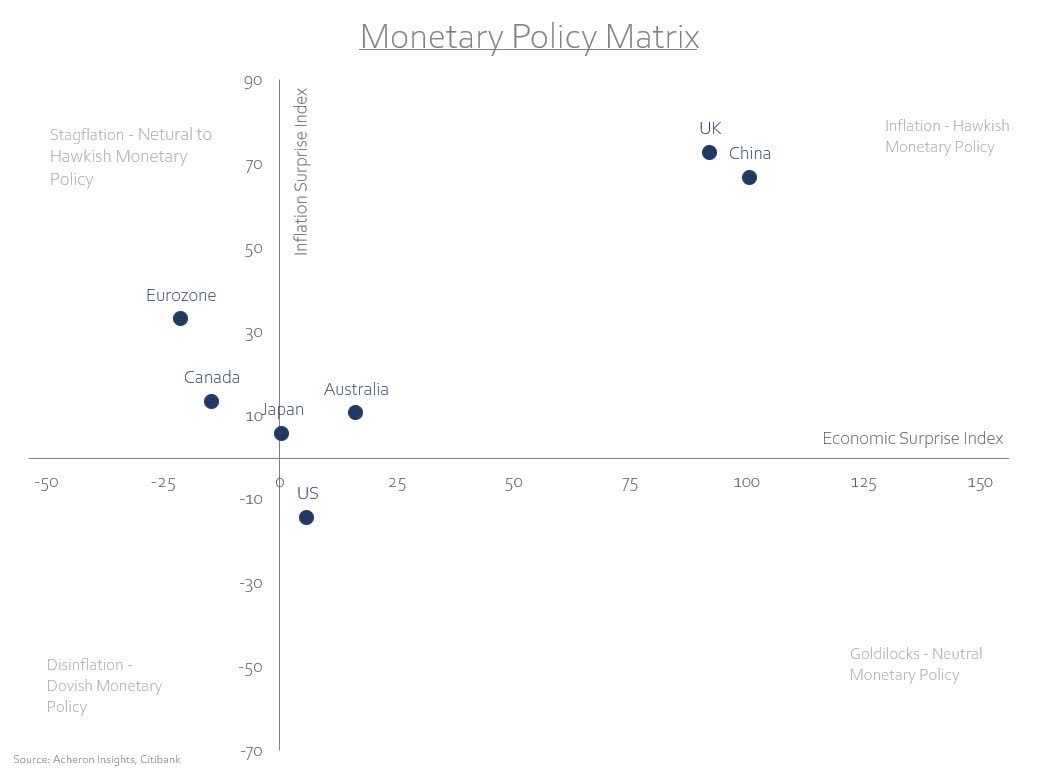
And unfortunately, given the persistent labour market tightness, wage growth, and stubbornness of inflation we have discussed thus far, though the Fed is most likely done raising rate to any material degree, I suggest you take them at their word when they say “higher for longer”. In fact, when assessing the outlook for monetary policy on the basis of inflation versus economic growth, most major central banks still have little scope to be cutting, let alone pausing.
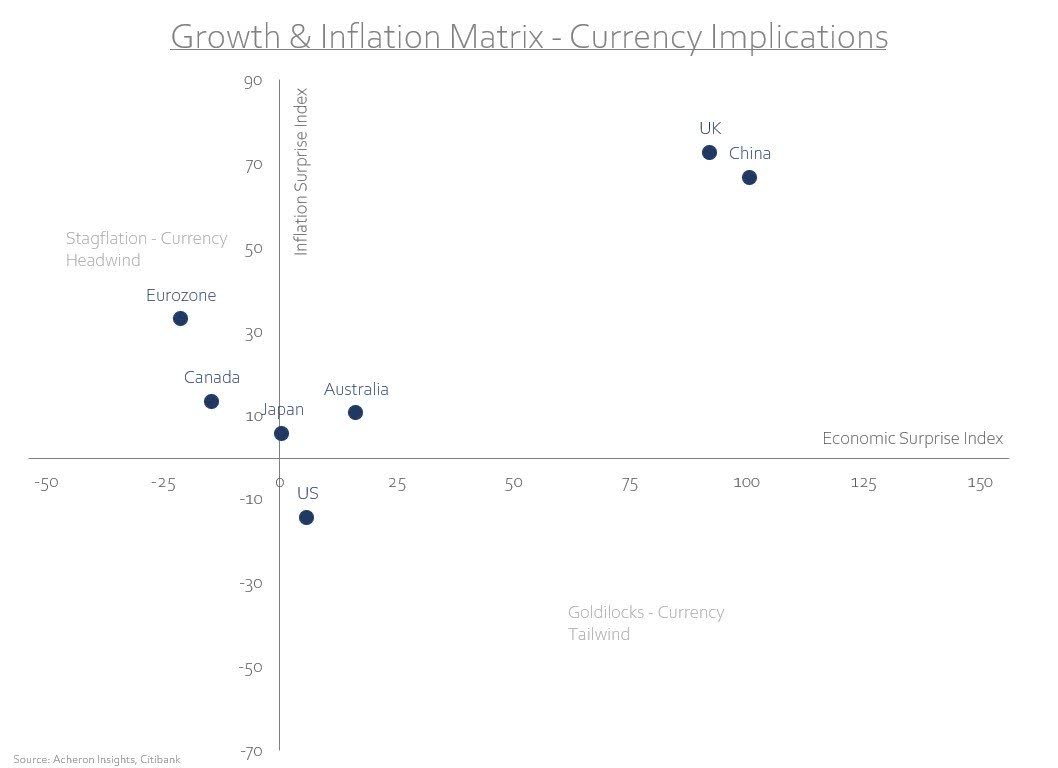
One key asset that may benefit from a higher for longer Fed and a slowing economy is the US dollar. The dollar tends to perform best during periods of economic expansion where US growth exceeds global growth and during periods of global economic weakness where we see flight to safety flows back into US dollar-denominated assets. Any potential recession or economic slowdown could well result in the latter.
Especially when dollar bearishness is once again reaching extreme levels. The dollar sell-off may have gotten a little long in the tooth for now. Though I remain bearish over the medium term, one must respect these shorter-term dynamics. Consensus rarely pays.
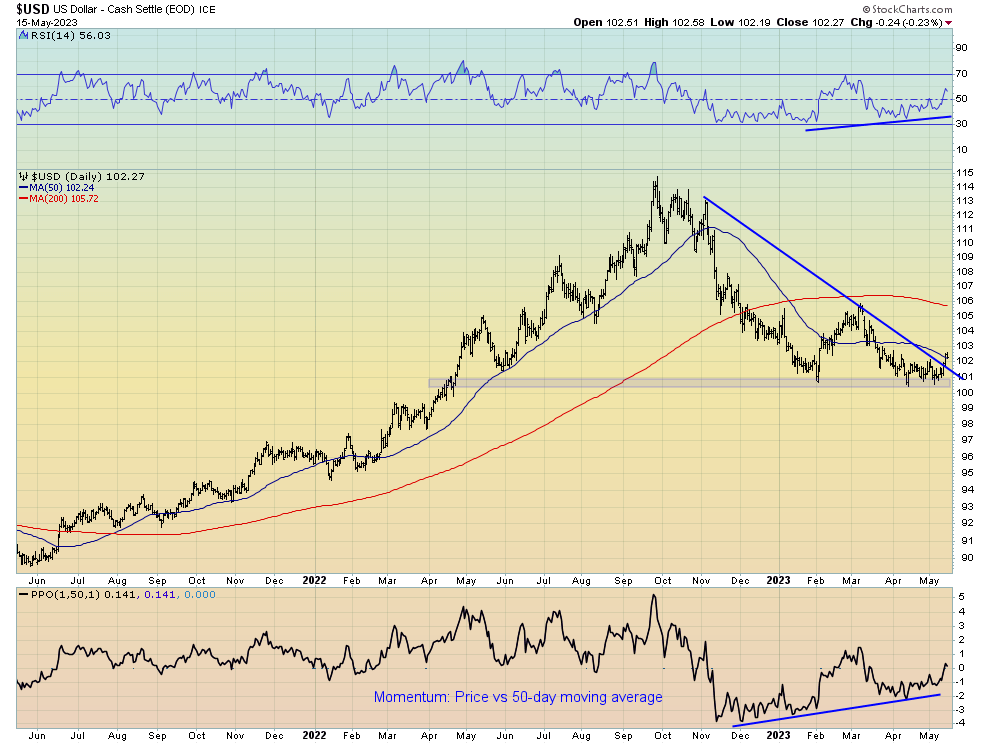
Source: Morgan Stanley via Macro Ops From a technical perspective, after the dollar index corrected roughly $15 since the September peak, major support is now around the $100 level. The latest test of this area was met with significant bullish divergences in momentum and looks like it could be the stage for another move higher.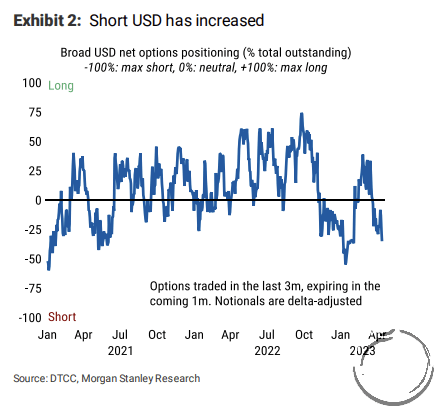
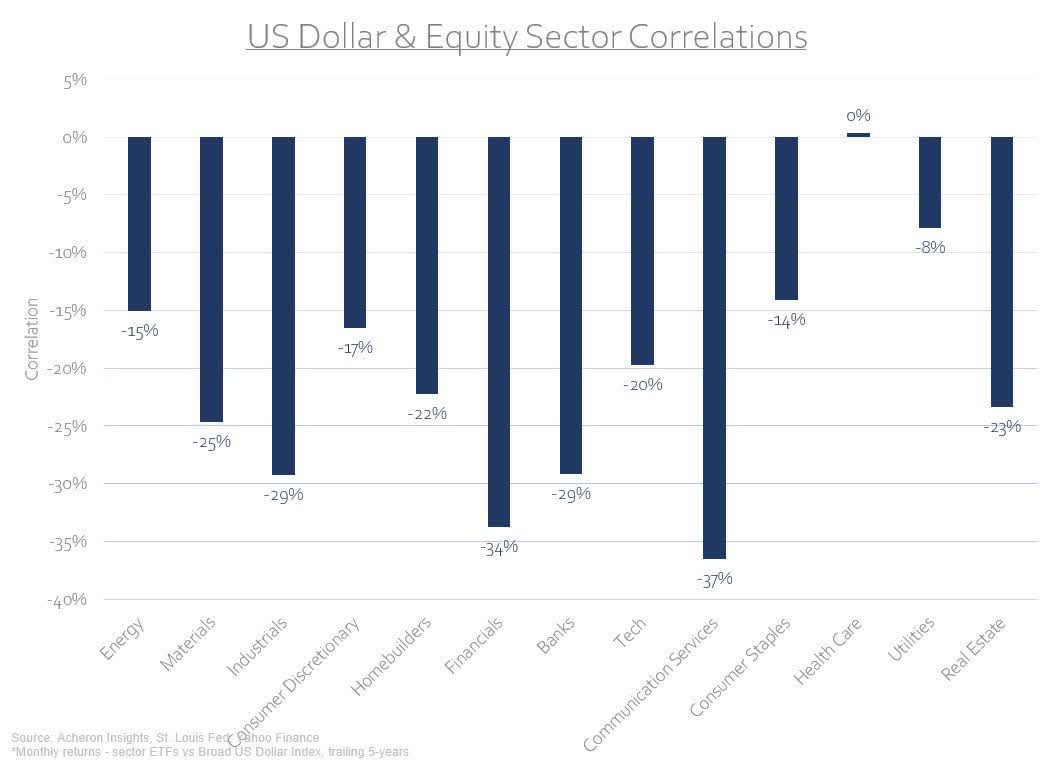
Should such a move eventuate, it likely spells trouble for a number of the most cyclically sensitive areas of the stock market. The sectors which tend to exhibit notable negative correlations to the dollar – namely materials, industrials, financials, and communications – look to be the most vulnerable to a dollar rally.
Where the market and real economy as a whole look increasingly vulnerable though is the continued deterioration of the credit cycle. We are beginning to see tighter financial conditions translate into real economic pain, with regional banks thus far the primary victim. It is most likely through the deterioration in the credit cycle to which material headwinds for both economic growth and equity markets could arise and a dollar rally ensue.
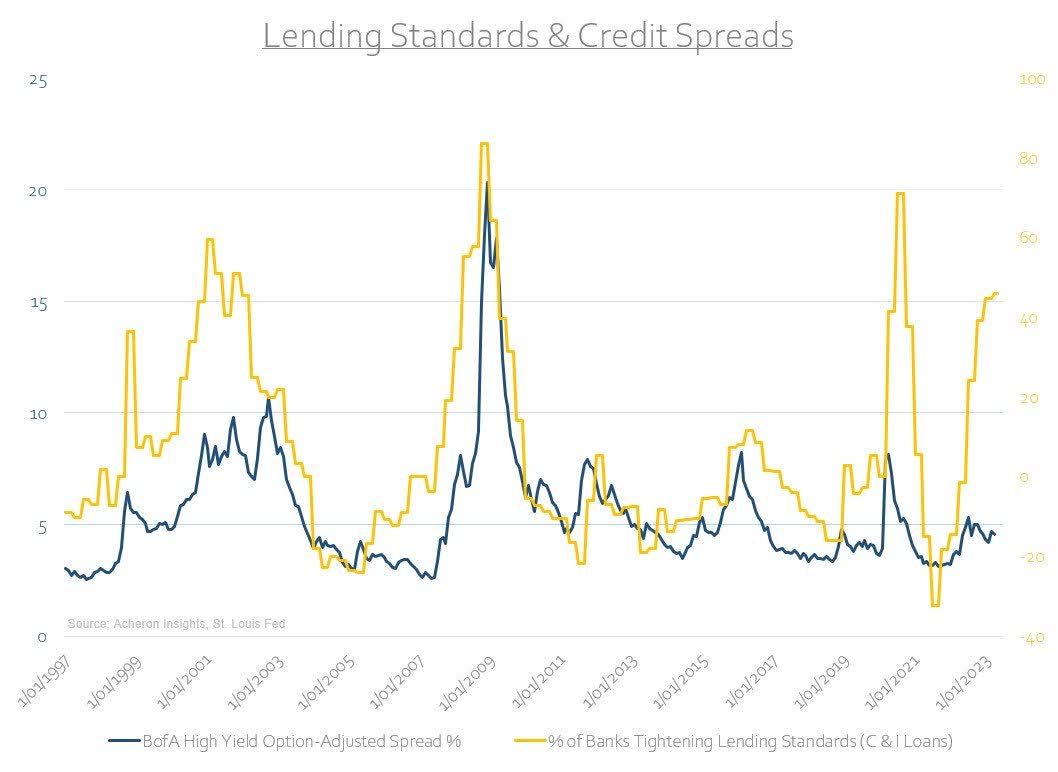
A dynamic I have opined upon frequently of late, credit looks to be the next shoe to drop. The tightening of lending standards continues to rocket toward cyclical highs, highlighting just how restrictive credit conditions are becoming.
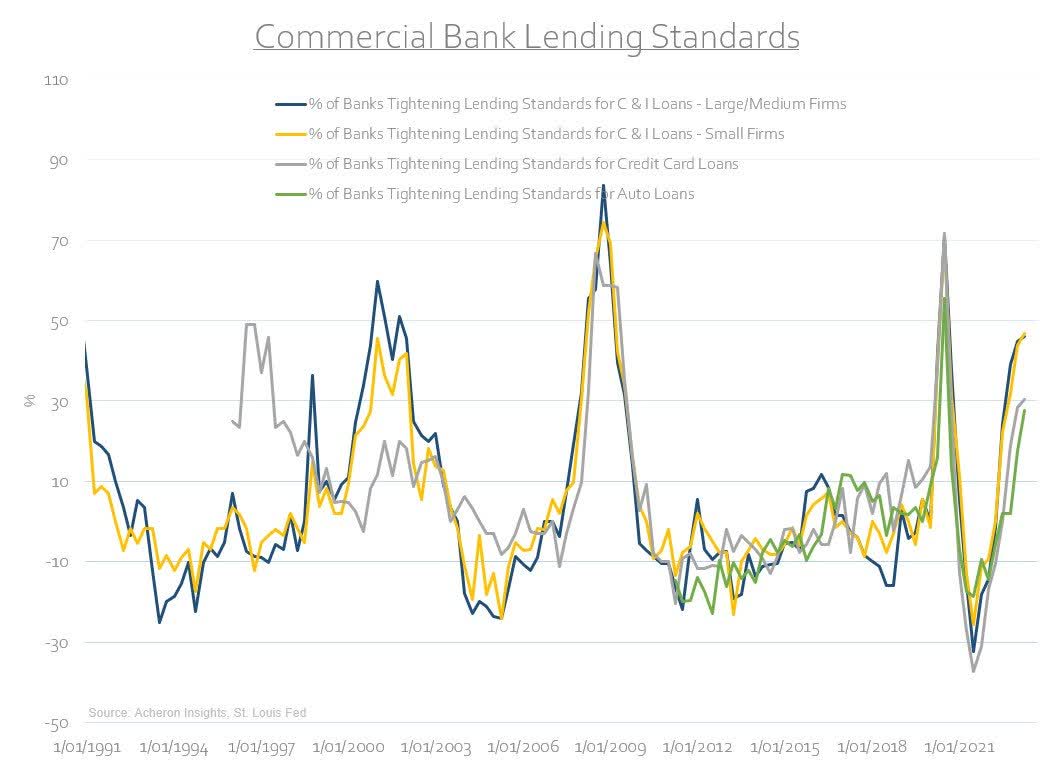
And thus, the availability of credit to firms who need it most is contracting. Such a combination usually results in much higher credit spreads compared to current levels.
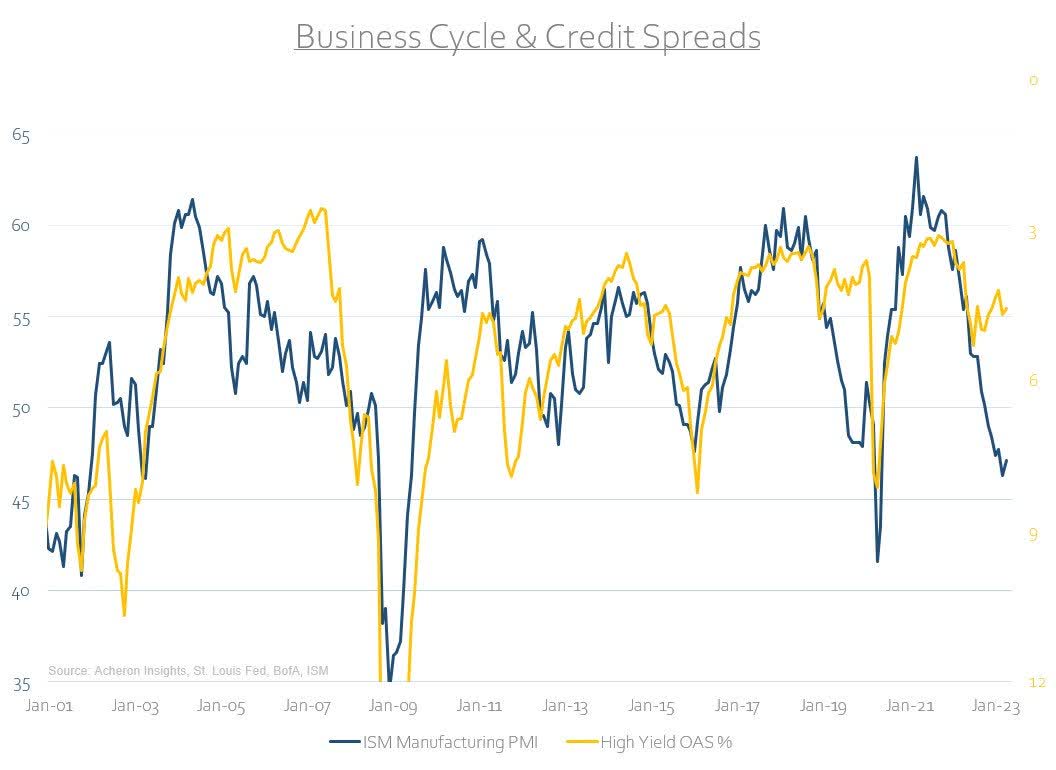
The deterioration of the credit cycle is perhaps the biggest risk facing markets. The problem is, credit markets themselves are far from pricing in any such outcome. High yield option-adjusted spreads are pricing the ISM Manufacturing PMI at over 55 – expansionary territory. Something’s got to give.
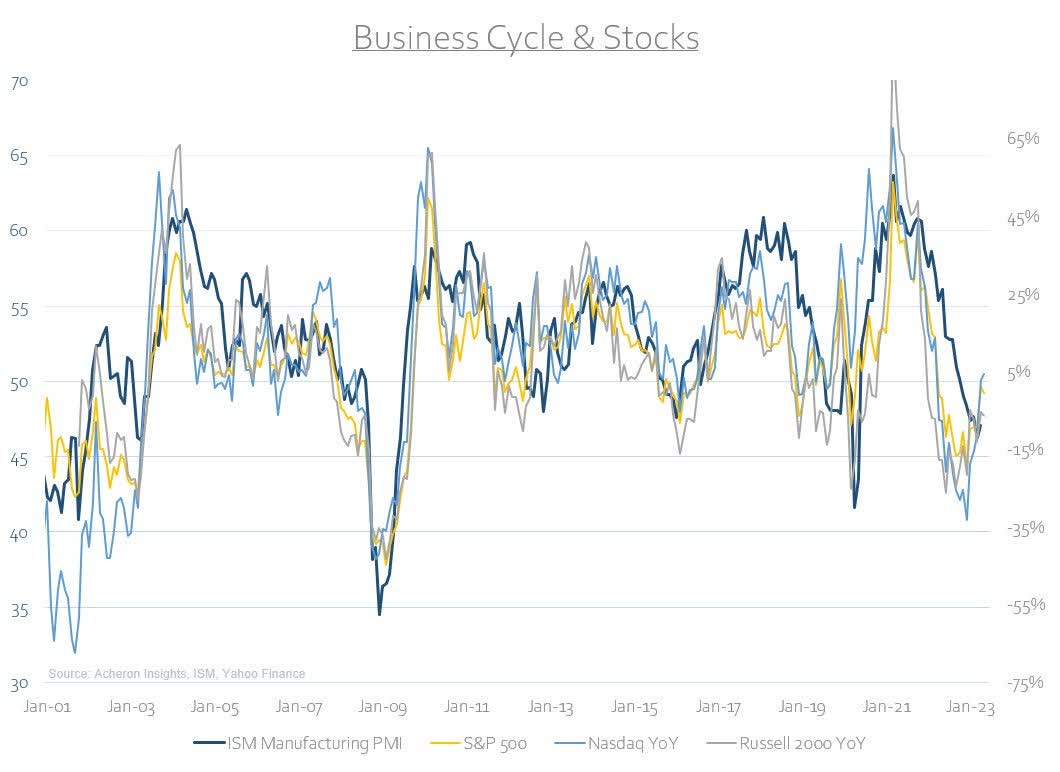
Stocks on the other hand have arguably done a better job of pricing in any potential recession.
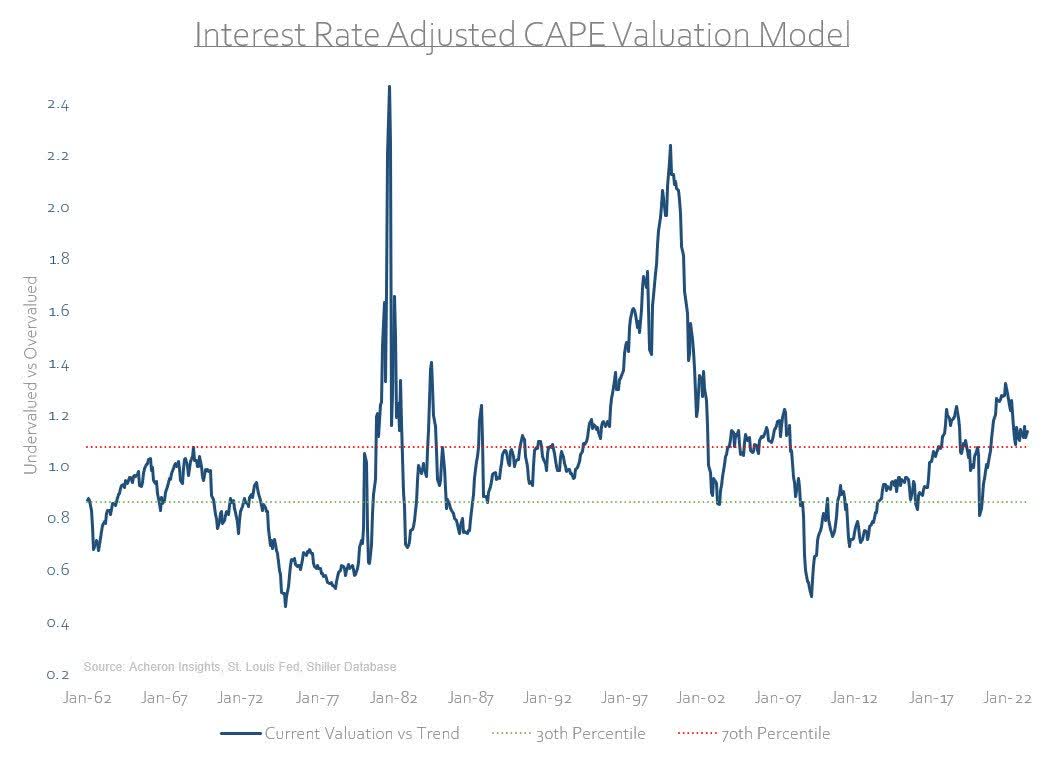
But, let’s not forget the S&P 500 is still very expensive, even after adjusting for higher interest rates.
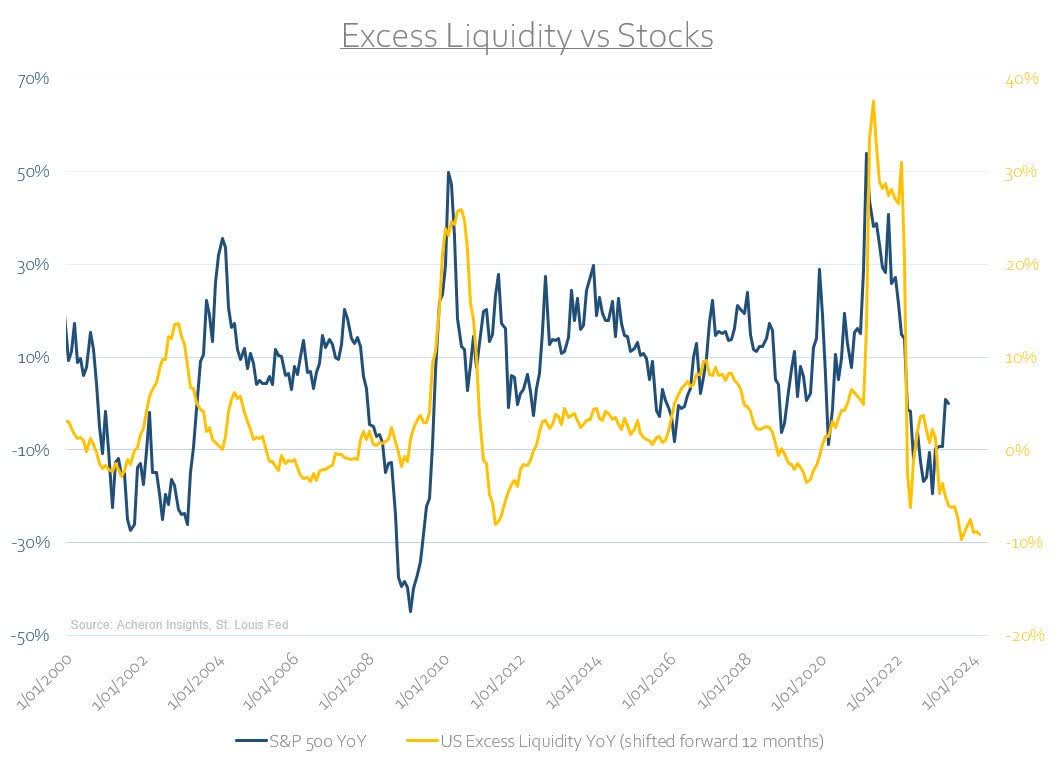
For those suggesting buying stocks is the way to go based on the outlook for liquidity, I would urge caution. US excess liquidity tends to lead the stock market by around 12 months and is yet to inflect higher. An uptick in the liquidity cycle will come at some point, but the Fed won’t turn on the taps until it has too. The game has changed in my book. With inflation and wage growth at current levels, we likely require a material amount of pain to be felt within the equity and credit markets to warrant dovish Fed action.
While liquidity has been supportive of markets since the latter half of last year, shorter-term measures look to be deteriorating as well.
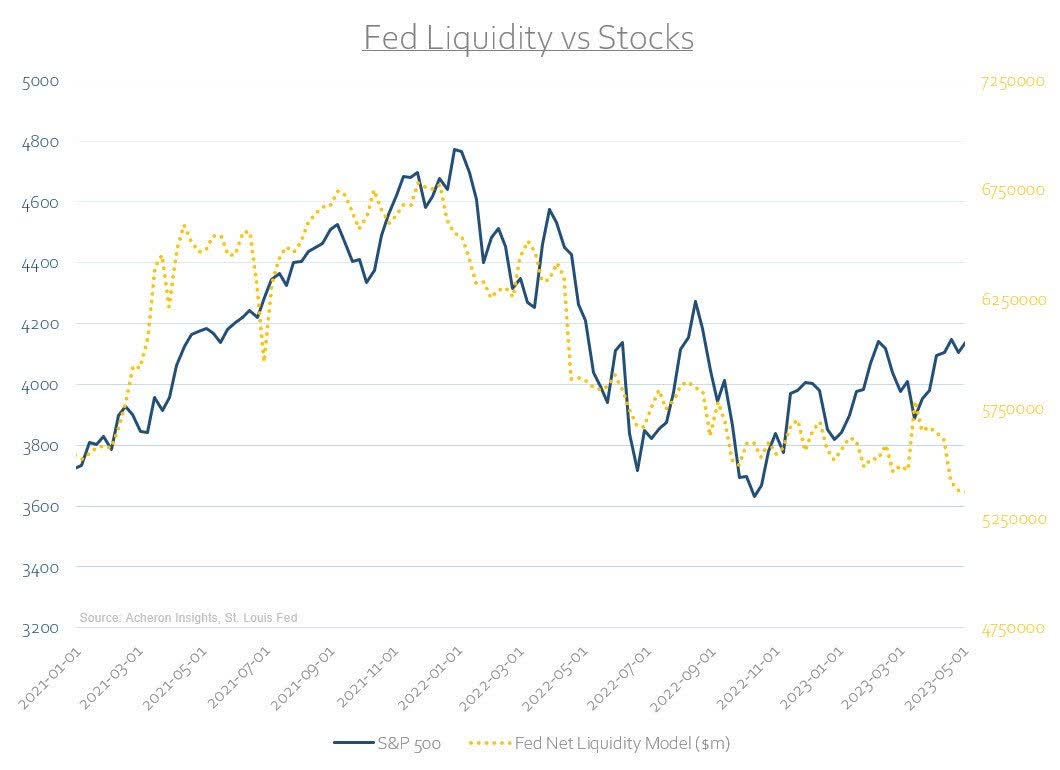
In fact, it has been the Treasury drawing down the Treasury General Account (TGA) during this recent period to which almost all the rise in net liquidity can be attributed.
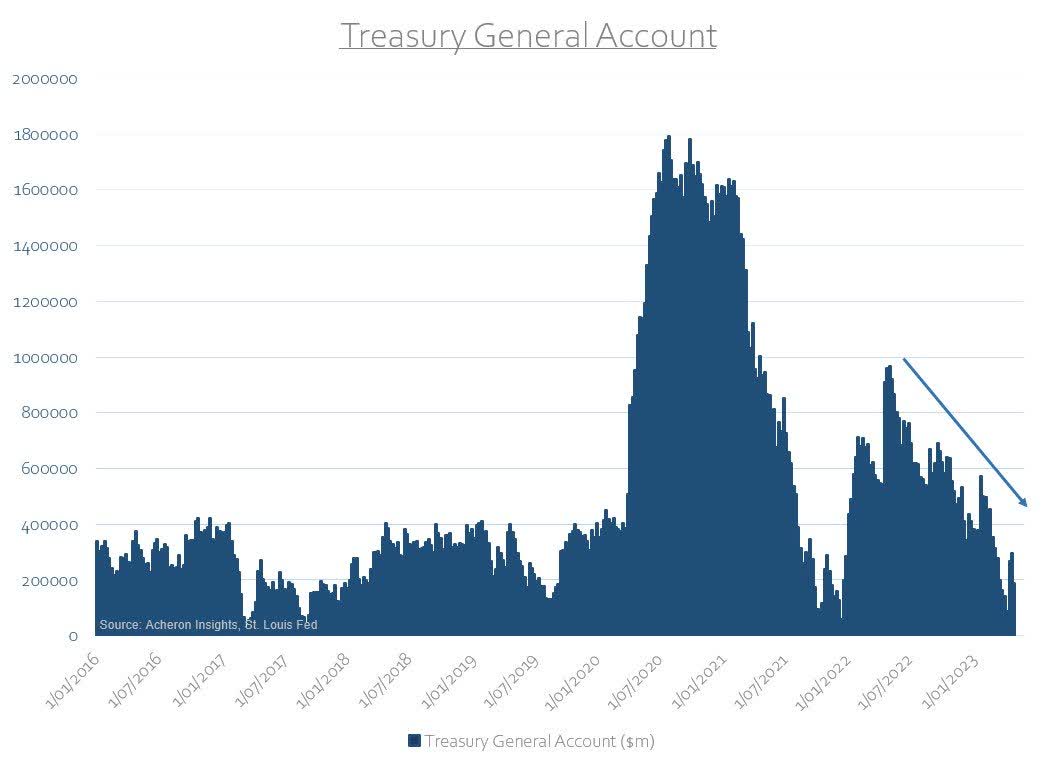
As it stands, the balance of the TGA is nearly depleted, so this trend will likely reverse course once the debt ceiling resolution is passed and Yellen can restock the TGA. Indeed, the US Treasury has indicated plans to undertake a significant amount of borrowing over in the coming quarters:
“During the April – June 2023 quarter, Treasury expects to borrow $726 billion in privately-held net marketable debt, assuming an end-of-June cash balance of $550 billion. The borrowing estimate is $449 billion higher than announced in January 2023, primarily due to the lower beginning-of-quarter cash balance ($322 billion), and projections of lower receipts and higher outlays ($117 billion).
During the July – September 2023 quarter, Treasury expects to borrow $733 billion in privately-held net marketable debt, assuming an end-of-September cash balance of $600 billion.”
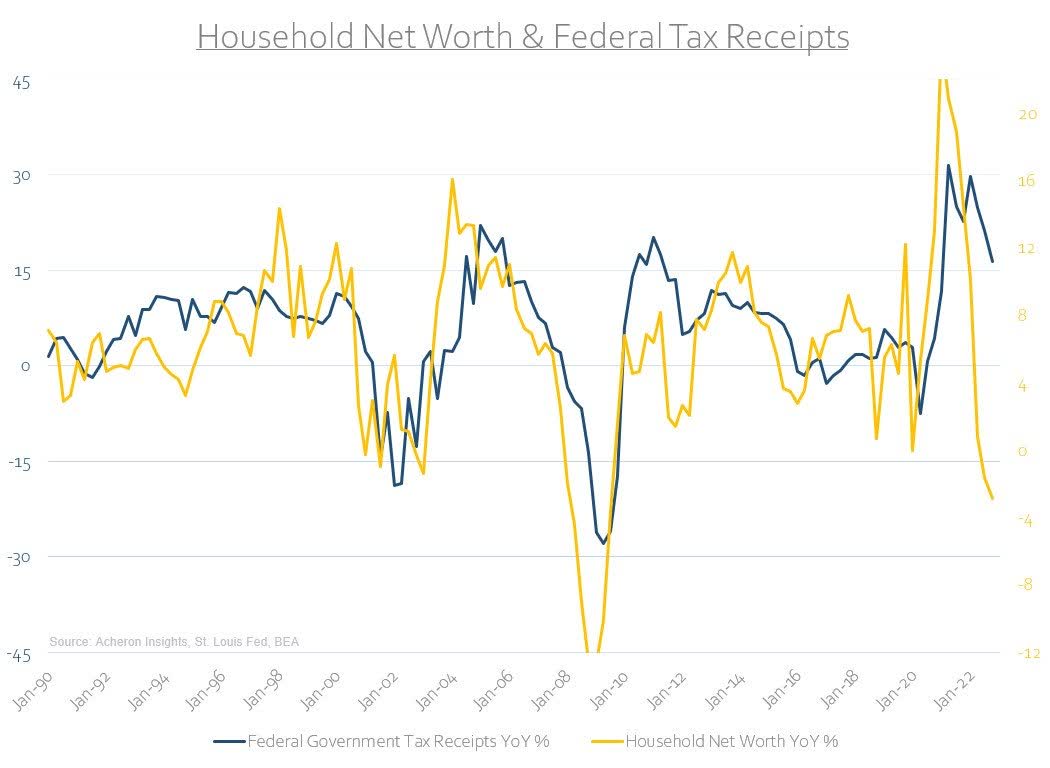
This is unsurprising given the recent trajectory of tax receipts – which tend to follow asset prices as a result of how financialised the US economy has become.
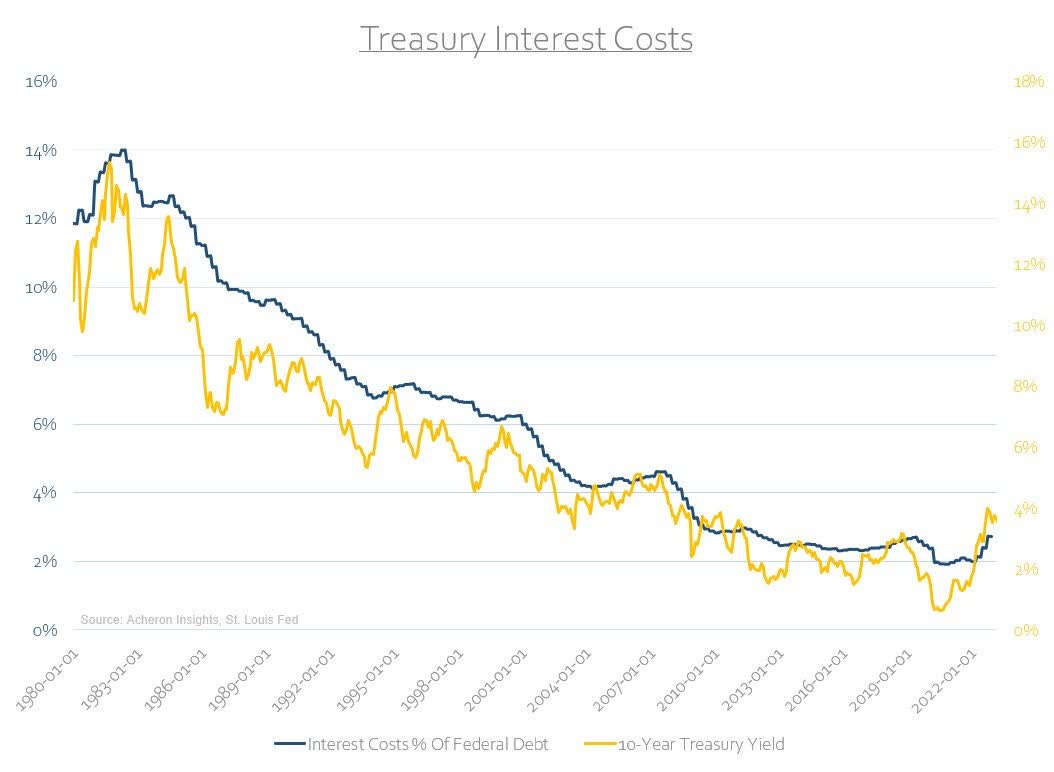
Rising interest costs don’t help either.
All the while, QT itself will continue to drain liquidity from the system. As long as the Fed continues contracting its balance sheet and remains higher for longer (which I believe they will), expect to see liquidity dry up as the year progresses. This would likely put a bid under the dollar as this debt issuance will need to be consumed by the private sector given the Fed is also a net-seller of Treasuries, while foreign institutions are no longer the buyer of US debt they once were. This is going to suck a lot of dollars out of the system, at least until the Treasury can again wind down the TGA or the Fed steps in with QE.
Overall, QT will see central bank reserve balances of the commercial banking system continue to decline – not a positive outcome for asset markets. Why does the level of bank reserves within the commercial banking system matter? Well, bank reserves are effectively money for banks, and thus act as the lubricant of the financial system. Commercial banks use reserves to settle transactions with one another and engage in repo or reverse repo funding, thus being an important form of liquidity required for smooth market functioning across the entire financial system.
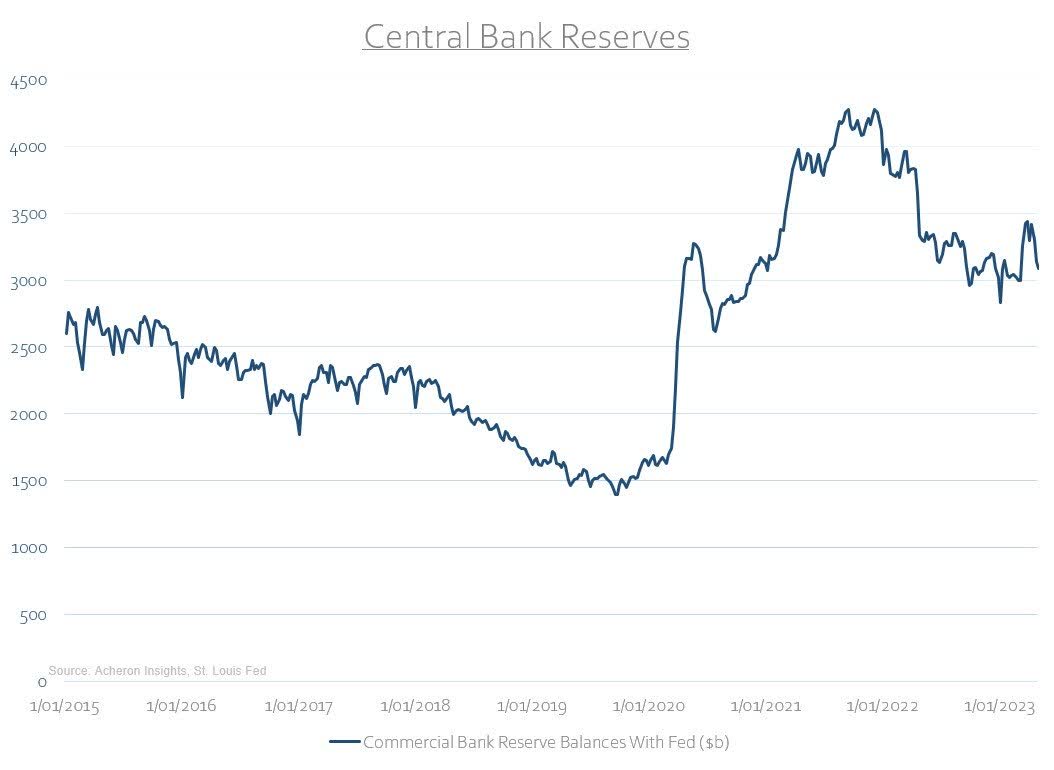
In terms of specific levels to watch out for, liquidity experts Cross Border Capital have suggested the minimum level of reserves required within the system is around $2.6-2.7 trillion, while Fed official Christopher Waller has also suggested a minimum level of around $2.5 trillion is required. Given we currently sit around the $3 trillion level, we are slowly approaching the levels whereby many financial plumbing experts much smarter than I suggest financial instability could ensue, putting a limit on how much further QT the Fed can undertake. But we aren’t there yet.
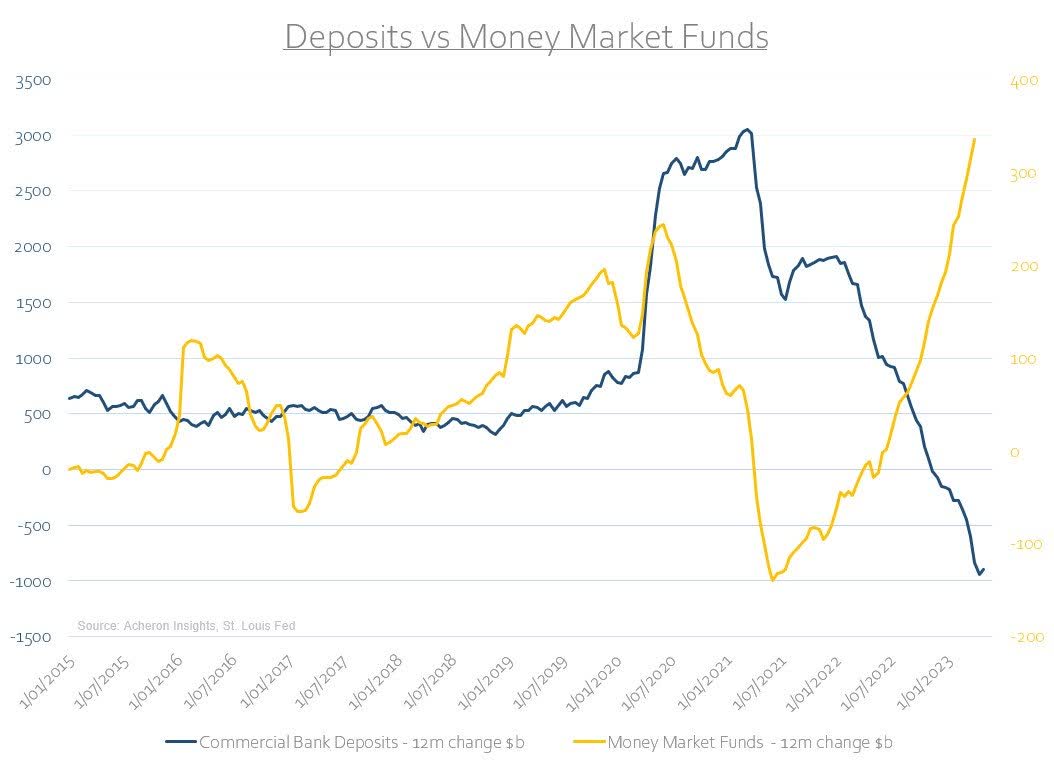
In terms of deposits, so long as rates offered by commercial banks on their savings and deposit accounts remain far below that of less-risky alternatives such as money market funds and short-dated government debt securities…
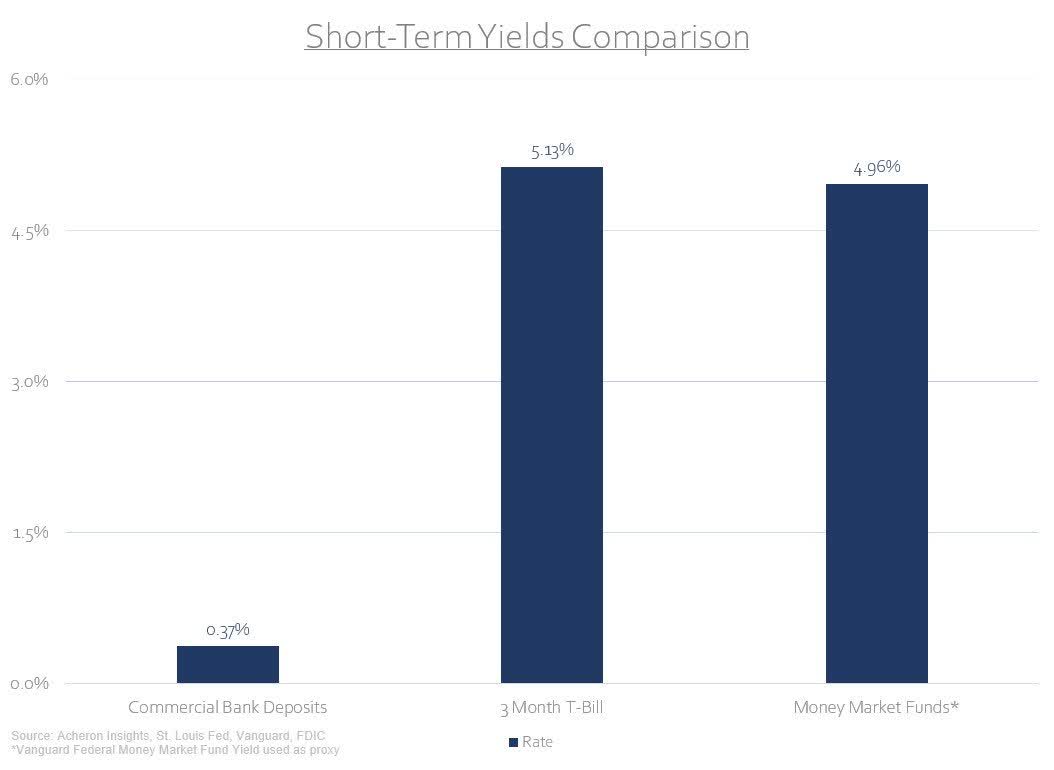
…then, commercial bank deposit outflows look likely to continue. Meanwhile, flows into these more attractive alternatives such as money market funds will continue to rise.
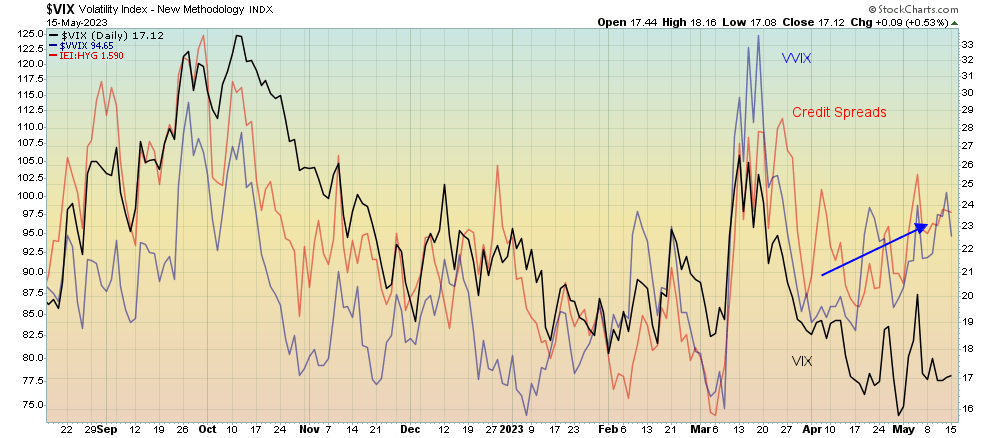
Debt ceiling drama, slowing growth, poor liquidity, deteriorating fundamentals, and tightening credit conditions all suggest volatility is due to rise materially at some point. This is a message to which two excellent leading indicators of volatility – in the VVIX and credit spreads – also seem to be sending, so perhaps this stress may be forthcoming sooner rather than later. Of course, if credit spreads do widen further as seems likely, then higher volatility is inevitable.
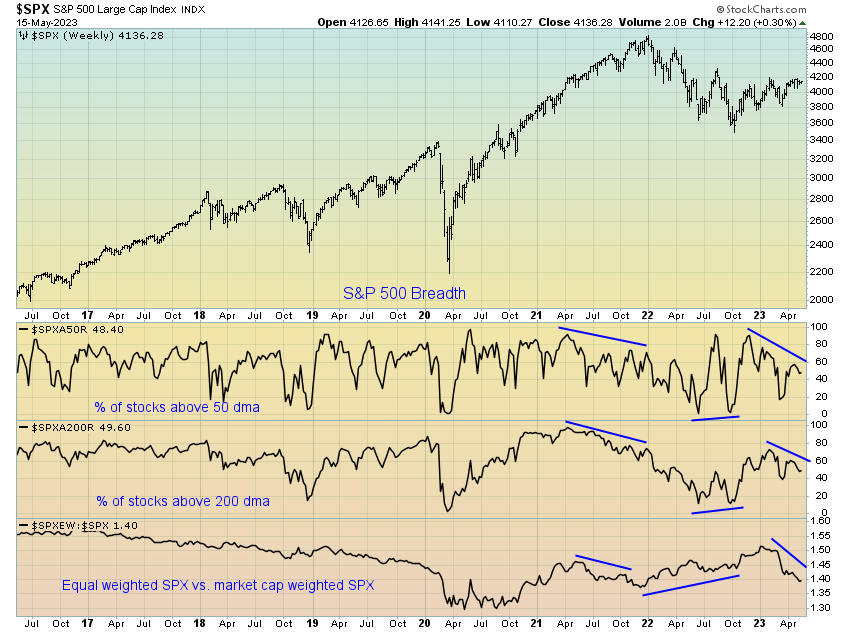
Meanwhile, stock market breadth is worsening by the day. Not a sign of a healthy market to be sure.
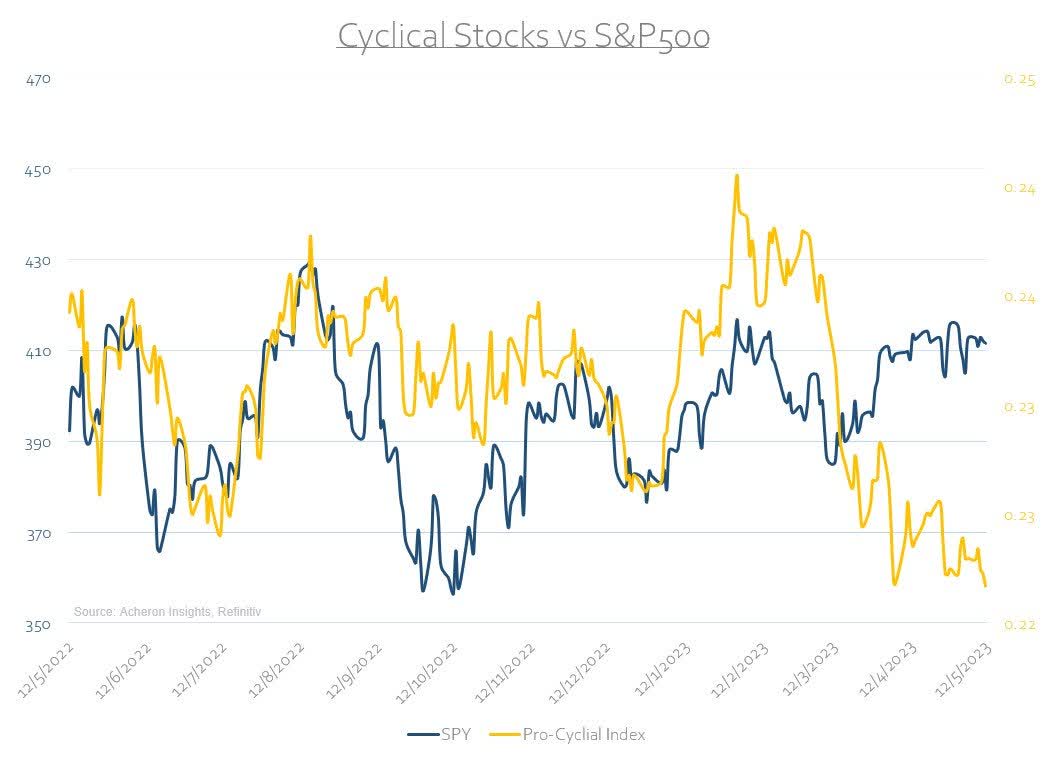
Nowhere is this more prevalent than within the pro-cyclical areas of the stock market. My pro-cyclical index, which consists of the relative performance of cyclical sectors such as retail, industrials, materials, transport, and financials, has diverged negatively to the broad index to a material degree over recent weeks. Such divergences tend to resolve themselves to the downside.
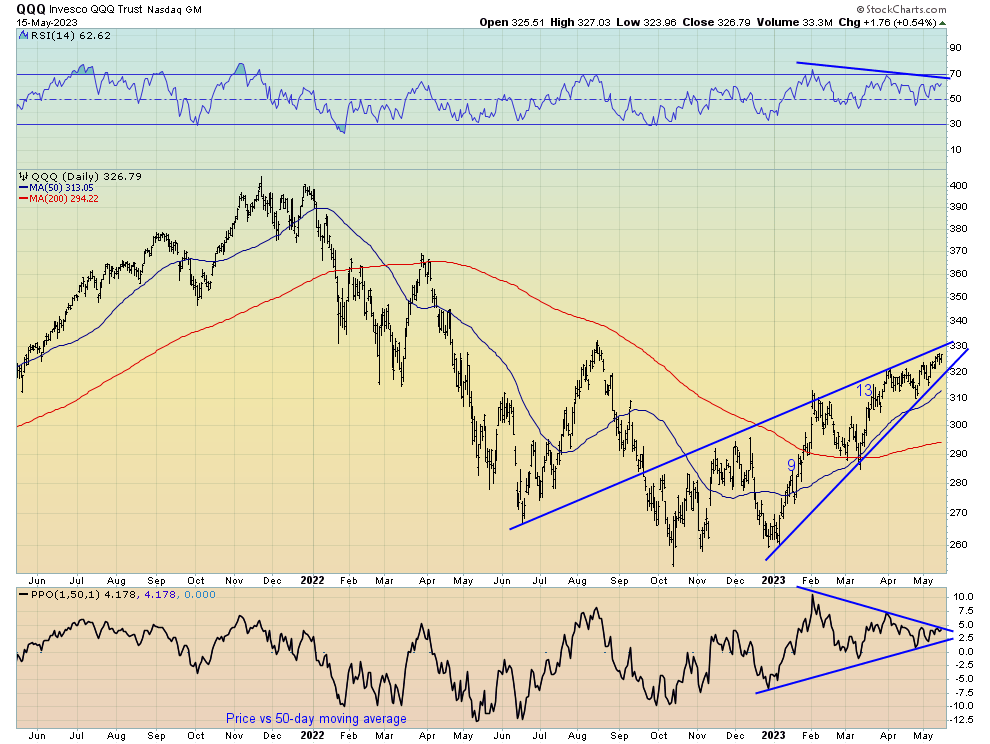
Indeed, it may be the Nasdaq is the last shoe to drop. The technical picture looks to be deteriorating rapidly. The latest highs are on the back of notable negative divergences in momentum, all the while the price action looks to be forming an ascending wedge pattern. Such a technical structure is generally indicative of an impending reversal in trend.
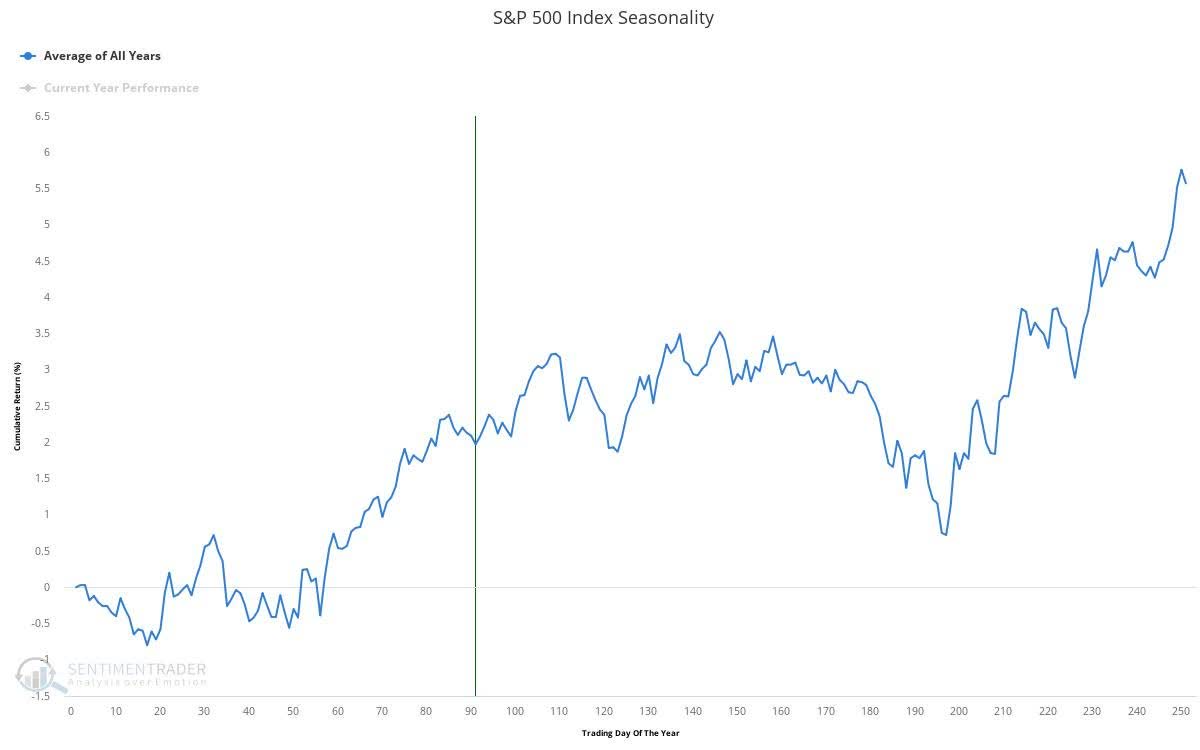
And of course, seasonality is looking less and less friendly toward equities. After all, the old adage is to “sell in May and go away”.
Meanwhile, earnings estimates are perhaps still a little too generous…
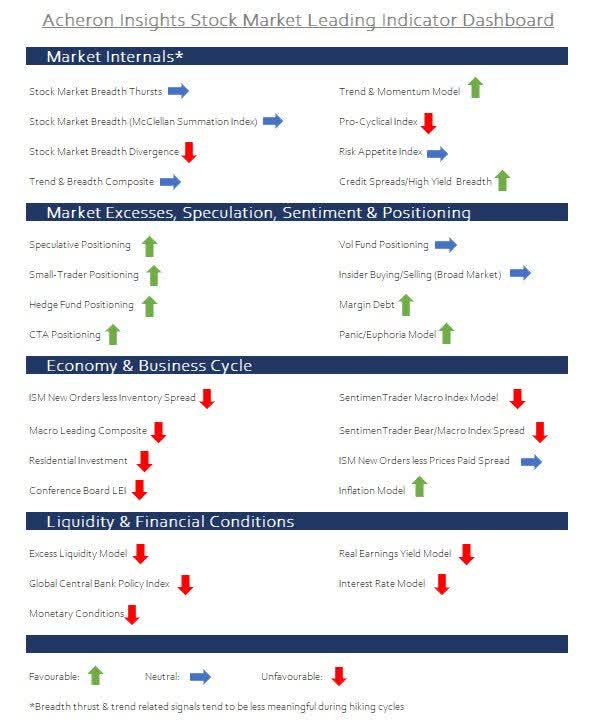
Source: Morgan Stanley Research Overall, my compendium of leading indicators for the stock market remains largely bearish, particularly on an economic and liquidity basis. Market internals too seem to be slowly deteriorating.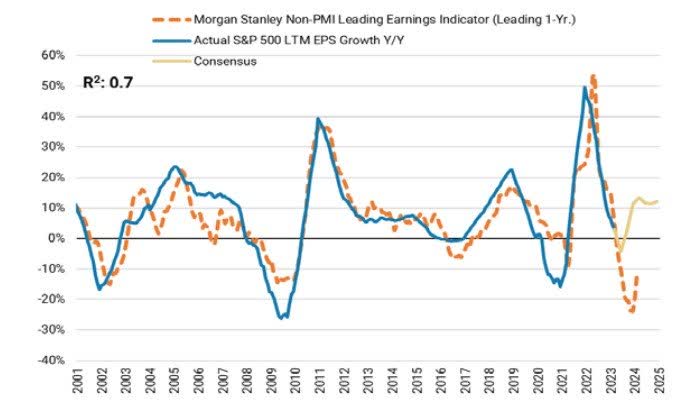
There is of course one giant caveat… positioning. For much of the reasons outlined herein, everyone is still bearish. Perhaps, this suggests the pain trade could continue to be to the upside, as is the markets want to inflict the most pain possible toward the consensus.
This positioning dynamic is true of speculative positioning overall.
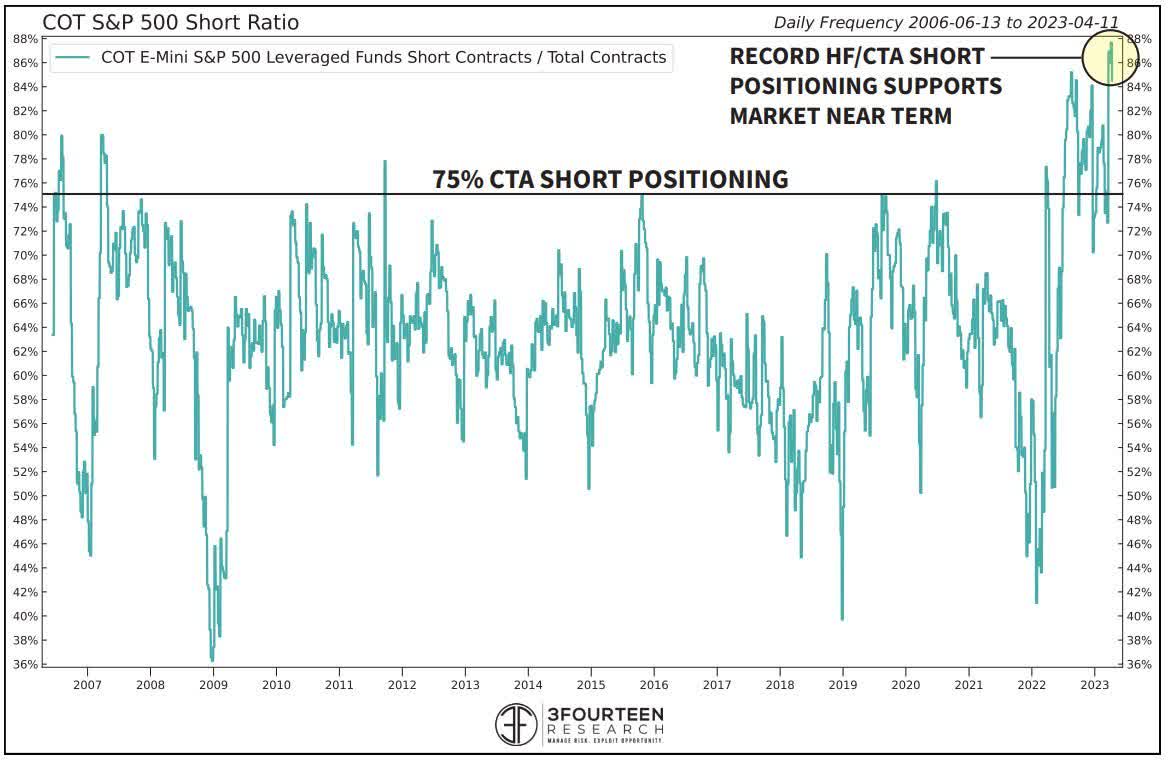
Source: @TheDailyShot As well as hedge funds and CTAs. Source: 3Fourteen Research It is very difficult for the market to go down when everyone is positioned for that outcome.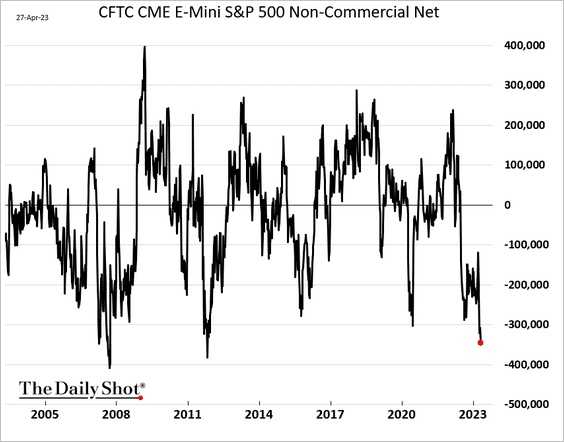
For bonds, however, the fundamental picture continues to look increasingly favourable. Bonds remain wholly mispriced from a business cycle perspective.
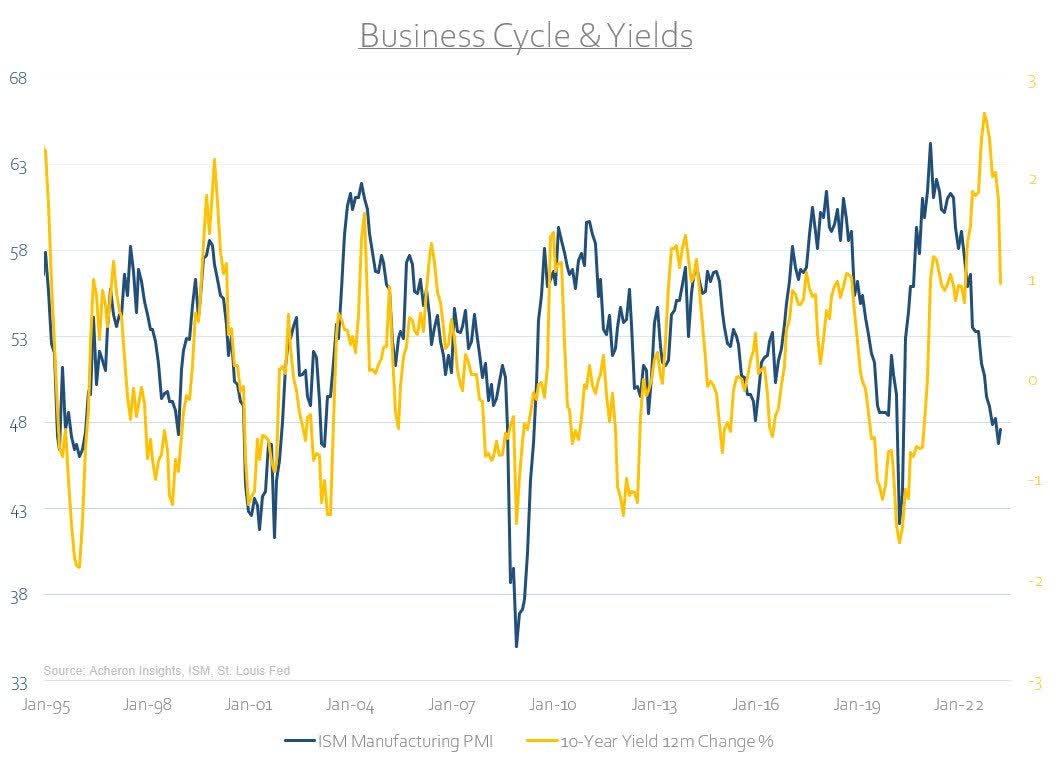
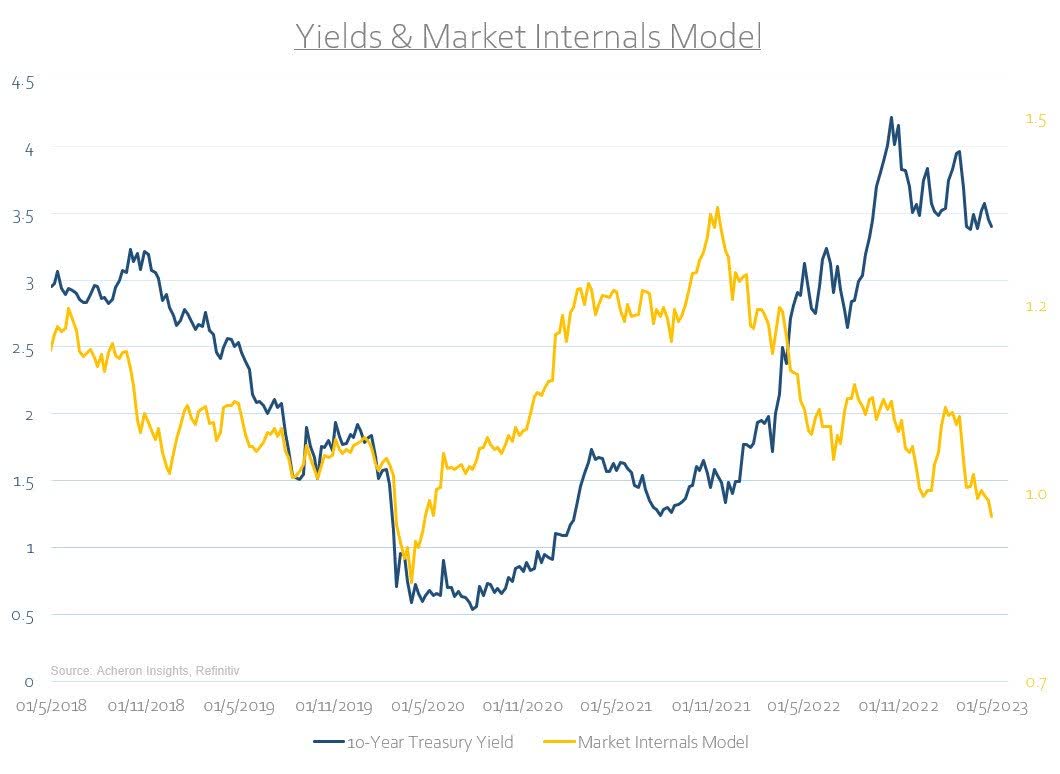
While market internals have been signalling a top in yields for some time.
The fact that positioning towards bonds remains the most bearish in decades only reinforces the bullish bond thesis.
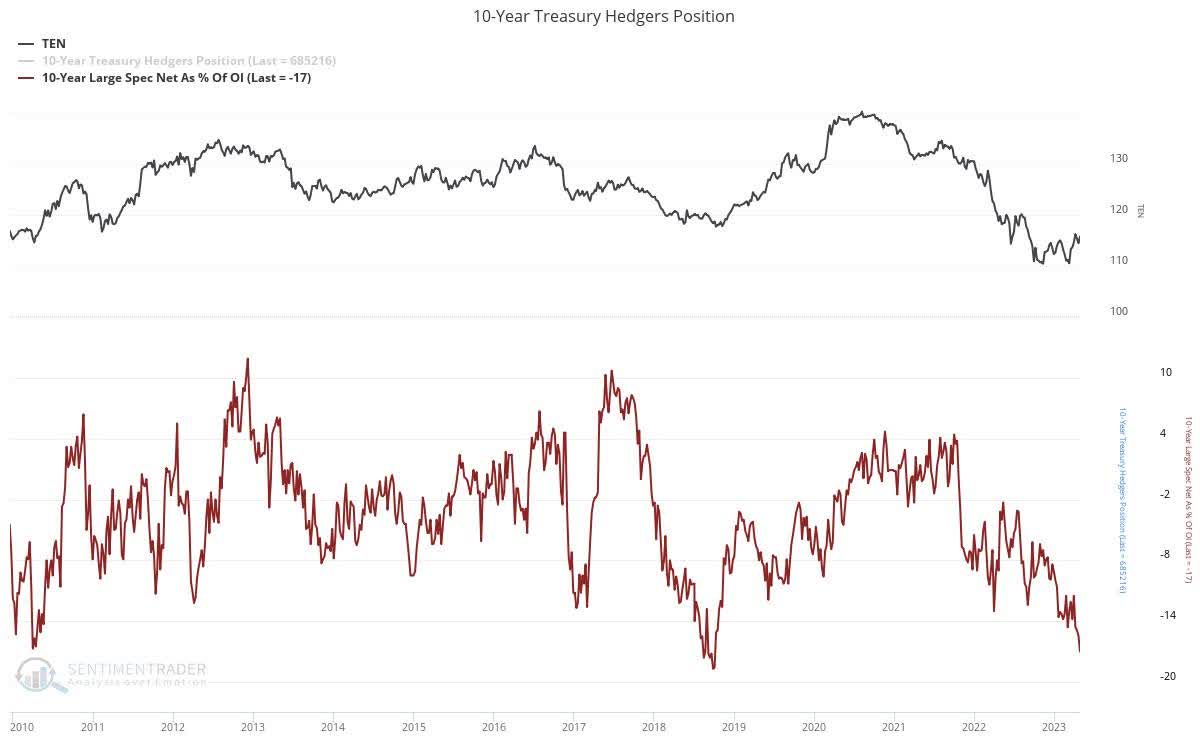
However, it may still be too early to take material duration risk. A significant amount of forthcoming debt issuance by the US Treasury in the face of a central bank undertaking QT and a strong dollar disincentivising foreign financing does create a risk whereby the supply and demand mismatch squeezes yields higher, even though the business cycle suggests they should be lower.
The likelihood of this dynamic eventuating is likely to increase should we see another move higher in the dollar. When accounting for hedging costs for foreign institutions looking to buy Treasuries (most notably Japanese pension funds and life insurers, who tend to hedge their FX exposure), the approximate yield offered by US debt remains negative for both Japanese and European investors. A stronger dollar would push this further negative, thus incentivising foreign capital to favour JGBs or German bunds as higher-yielding alternatives to US debt.
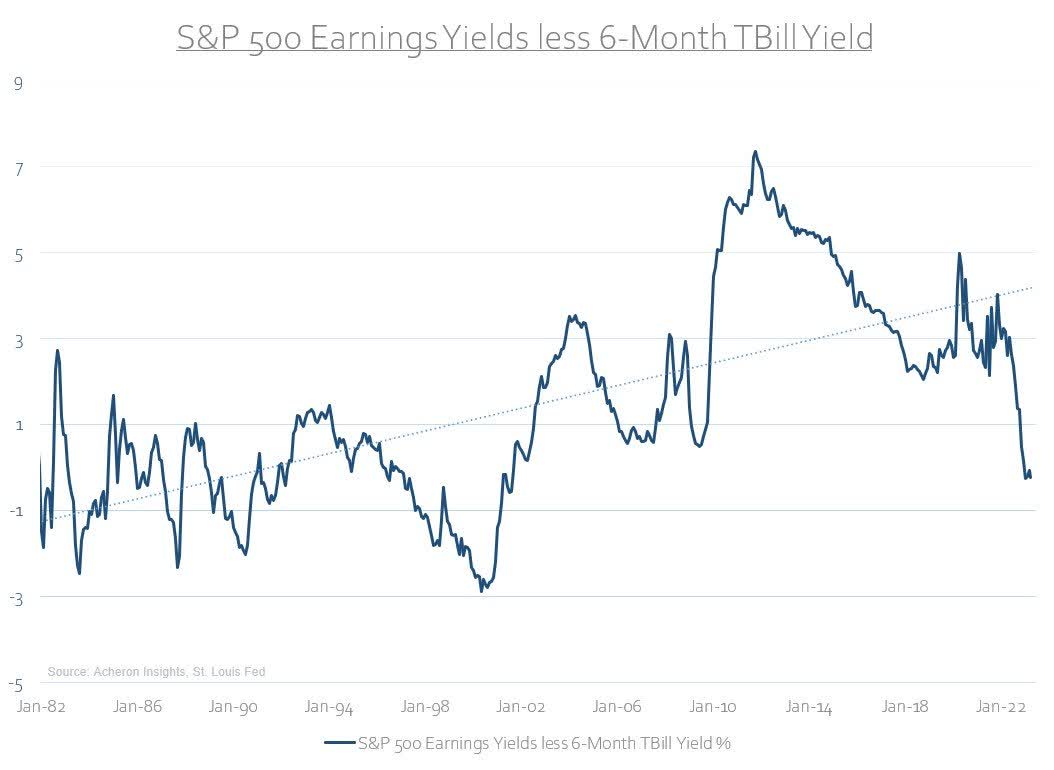
Source: Bloomberg via FFTT However, the fact that short-term US debt is offering yields in excess of their higher duration alternatives underscores an important point for investors; there is simply no need to take any material duration risk, credit risk, or high-beta risk of any type for the time being. There is now an alternative to risk, and its yield is pretty good.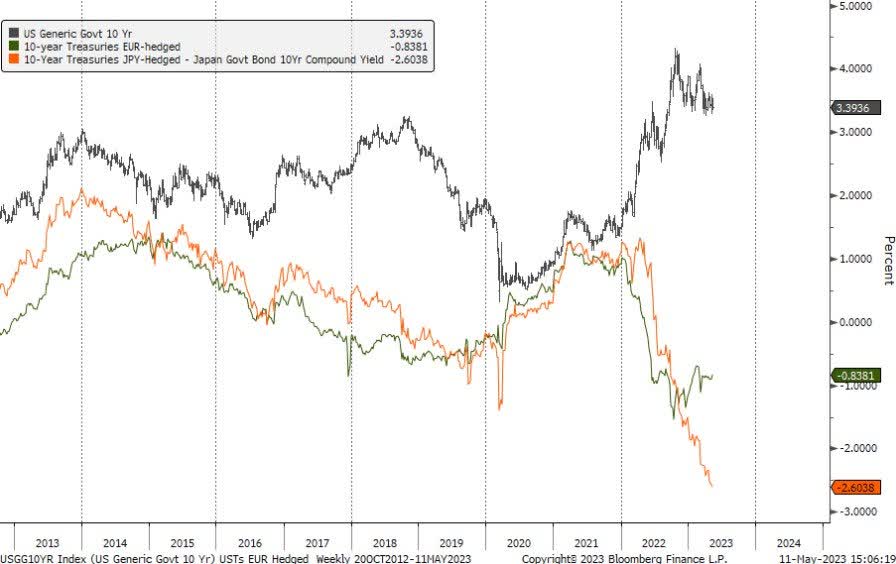
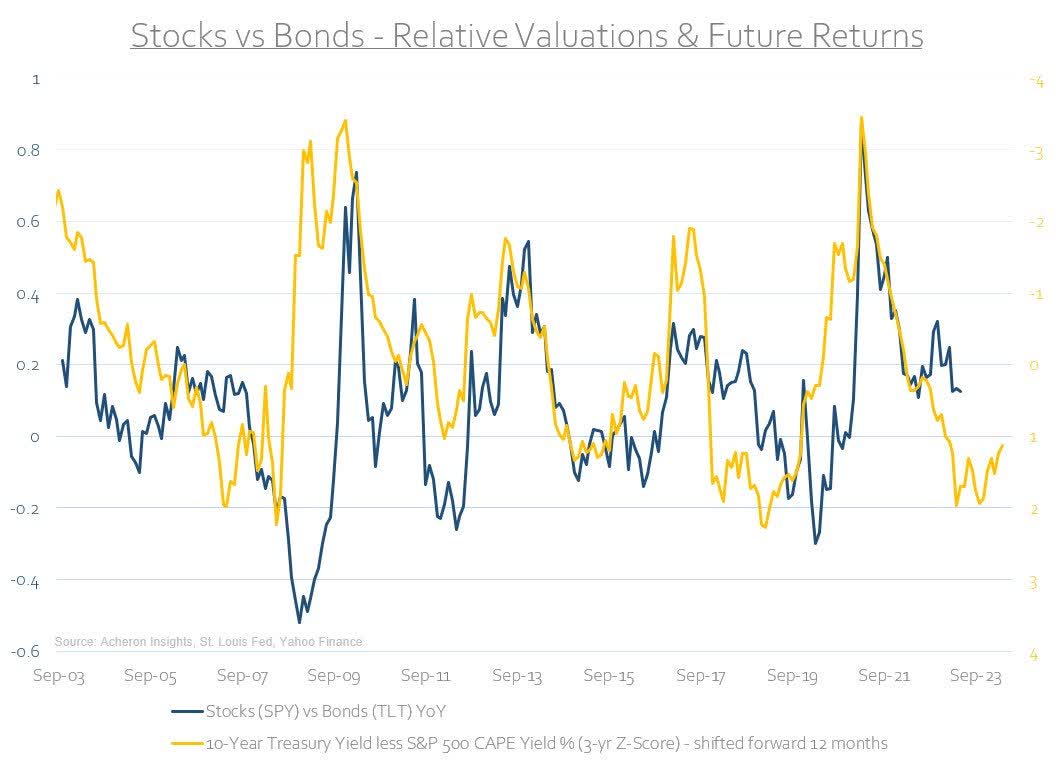
In closing, what can be said with a fair amount of confidence in relation to the stock vs bond outlook is, given their relative valuation dispersion (stocks expensive, bonds cheapish), the latter should outperform the former through the next stage of the business cycle.
Original Post
Editor’s Note: The summary bullets for this article were chosen by Seeking Alpha editors.
Read the full article here

