Written by Nick Ackerman, co-produced by Stanford Chemist. This article was originally published to members of the CEF/ETF Income Laboratory on April 28th, 2023.
Since we last looked at DoubleLine Yield Opportunities Fund (NYSE:DLY), things have become a bit more positive. That is despite the risks in this portfolio, given the economic uncertainty going forward. The positive performance was also a reversal from my earlier updates, which ended up being too soon to get bullish.
DLY Performance Since Initiating Buy (Seeking Alpha)
I initially went with a buy rating in May 2022. The declines since that time were -2.19%. However, during that period since there were periods where losses would have been deeper. A recovery since our last update helped to moderate the declines. The narrowing discount since then highlights why buying funds at a discount can help produce better relative returns.
Now, I wish I had only followed my own suggestions because I actually ended up starting a position toward the end of 2021. So my personal losses are deeper at this time compared to what they otherwise would be.
First, the discount on the fund itself is quite attractive – even after narrowing since our last update. Secondly, everyone knows there are risks in the current environment, which has heavily discounted the fund’s underlying debt instruments. Thirdly, diversification with the portfolio spread across hundreds of holdings. In fact, if you broke out the MBS securities, you are looking at hundreds or even thousands of different loans backing their securitized debt.
Finally, interest rates pausing as is expected with the next interest rate hike could also be beneficial to this fund. At the very least, we should be closer to the end of the rate hikes than the beginning, even if we get a few more hikes.
While the fund poses some elevated risks due to its below-investment-grade debt holdings and being leveraged, I believe it is still worth considering. I still remain more on the bullish side. However, if a rating was available for slightly bullish, that’s where I’d be. In between a “hold” and a “buy.”
The Basics
- 1-Year Z-score: 1.10
- Discount: -7.35%
- Distribution Yield: 10%
- Expense Ratio: 2.60% (including interest expense)
- Leverage: 21.01%
- Managed Assets: $903.834 million
- Structure: Term (anticipated liquidation date February 25th, 2032)
DLY’s investment objective is quite simple: “seek a high level of total return, with an emphasis on current income.” To achieve this, the fund will “invest in a portfolio of investments selected for its potential to provide a high level of total return, with an emphasis on current income. The Fund may invest in debt securities or other income-producing investments of issuers anywhere in the world, including in emerging markets, and may invest in investments of any credit quality.”
The fund is more moderately leveraged than we can see from some other multi-sector bond fund peers. I’m primarily thinking of PIMCO, which frequently has leverage above 40%. However, there has been deleveraging taking place to keep the leverage ratio lower. So that means they are still going to experience the negative side that deleverages poses, which is when there is a recovery having fewer assets to rebound with. More recently, leverage was closer to $180.641 million based on the March 31st, 2023, difference between managed and net assets.
DLY Leverage Amounts (DoubleLine)
Even with deleveraging, the other risk of amplified moves in either losses or gains for the fund remains. Additionally, as interest rates rose, that meant rising leverage costs. All of these considerations don’t disappear with a mildly leveraged fund; the risks are only relatively mitigated
The arrangement for borrowing costs is a bit unusual, not something I’ve seen before, but this is exactly what it is from their last annual report: “…one-month daily 2-Day lag SOFR plus 0.10% plus 1.10%…”
Regardless, the main takeaway is that it’s based on a floating rate that increases as rates increase. Their fiscal year-end is September, and in 2022, the average interest rate was 2.05%. Since then, rates have only gone higher; meaning so has the borrowings. With SOFR around 4.8% today, borrowing costs are pushing around 6%.
The fund hasn’t employed any sort of derivative hedges against interest rates rising. That’s often something we’ve seen from plenty of other CEFs, implementing interest rate swaps or going short Treasury futures. Those are both actions that can help mitigate the downside of higher interest rates, but they also do come with their own costs. Instead, it’s likely that the managers believed the floating rate exposure in their underlying portfolio was sufficient enough.
Performance – Attractive Discount
Since the fund’s launch, the results haven’t been too pretty. To be fair, though, no fixed-income performance has been showing spectacular performance since this fund launched either. It has a relatively short-lived history, and with 2022 being such a bad year for almost all investments, that really dragged down the results.
Due to being leveraged, we saw that pay off during the 2020/2021 market rebound. However, that’s exactly what came back to bite the fund through 2022. I think the DLY total NAV return chart is a perfect representation of the positives and negatives of leverage in a relatively short period of time.
YCharts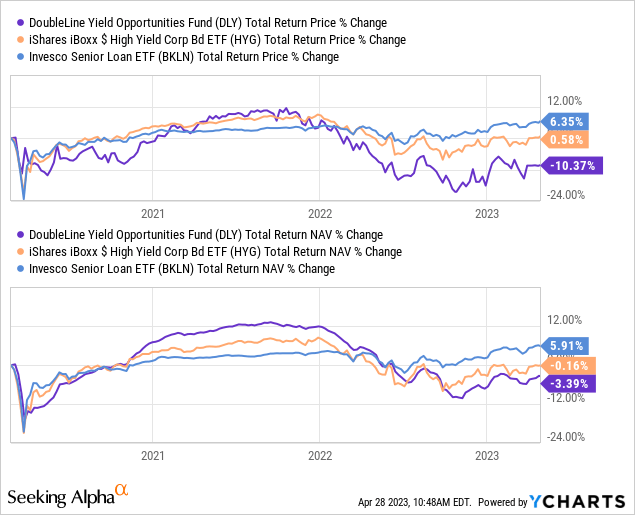
Thanks to a significantly widening discount, we can see that the actual total price returns were significantly more hindered. That’s precisely what brings up opportunities in closed-end funds; discounts and premiums are something that can often be exploited. Despite not being at quite the same deep discount it was in our previous update, I feel it is still fairly attractive at this time.
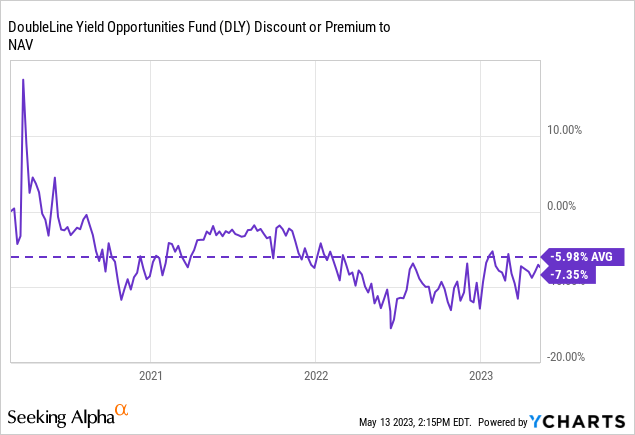
Newer funds often drop to deep discounts even when they are CEF 2.0 launches. CEF 2.0 are those that IPO around after 2018 and are term funds that launch with the advisor paying all the IPO fees. So this is a predictable pattern when funds launch.
Distribution – NII Relatively Stable
Thanks to the large discount, the fund’s distribution rate is 10%, while the NAV yield is 9.27%.
Interest rates rose, and so did their borrowing costs, as we discussed above. However, when breaking it down, thanks to floating rate exposure in their portfolio and a reduction in the utilization of leverage, the borrowing costs didn’t have too much of an impact on net investment income. Borrowing costs came out to $3.376 million in fiscal 2021, climbing to $5.796 million for 2022.
However, total investment income went from $82.392 million to $83.419 million. Not an extremely large jump, but combined with the reduction in investment advisory fees due to lower assets managed, we saw NII mostly flat.
DLY Annual Report (DoubleLine)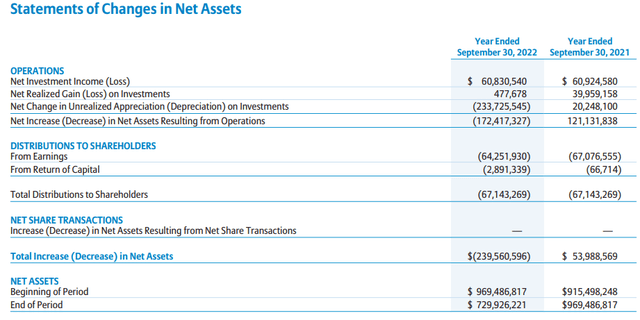
On a per-share basis, it worked out to $1.27 in each of the last two fiscal years. That should bode well going forward, where they can feel somewhat comfortable continuing to pay out the current distribution rate. It has been $0.1167 per month since its inception in early 2020.
However, I’d still like to point out that while NII was stable despite higher rates, the fund still isn’t covering its distribution through income alone. In the prior fiscal year, they only had NII coverage of 90.6%. So a cut can never be ruled out, but even more so in this case due to a lack of coverage.
DLY’s Portfolio
Being a fixed-income fund, the fund’s duration is quite an important metric. Duration is a measurement of how sensitive the underlying portfolio should be to interest rate increases. The latest for DLY puts it at a duration of 3.16 years. That should mean for every 1% change in interest rates, the underlying portfolio should move up or down 3.16%.
We know that they saw much deeper losses than that in the prior year, which is where credit risks come into play. At this time, besides the fund’s nearly 9% discount that it is sporting, the underlying debt instruments have an average market price of $82.67.
DLY Portfolio Stats (DoubleLine)
When looking at the allocation of the fund to underlying instruments, we see where the diversification starts coming in. Not only is the fund listing hundreds of holdings, but these holdings are divided among several different types of debt offerings. CEFConnect lists the number of holdings at 452.
DLY Portfolio Breakdown (DoubleLine)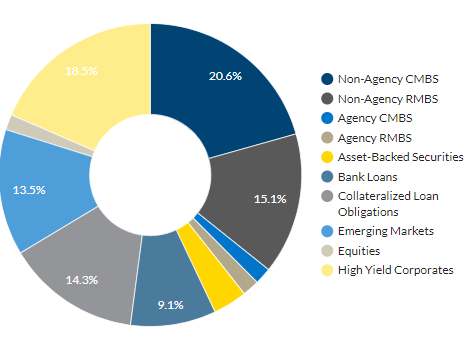
The primary allocation here is to non-agency MBS, both commercial and residential. Those are certainly areas that are going to be under considerable stress during a recession. However, within these asset-backed securities are hundreds or thousands of loans making up each. For the most part, though, this whole portfolio should be considered rather risky, with 61.94% considered below-investment grade and another 17.72% considered unrated. Investment-grade exposure for this portfolio comes in at 18.4%, agency MBS comes in at a skinny 1.19%, and government is at an insignificant 0.75%.
Worth noting here is that some of the MBS exposure here is through STACR or CAS positions. Fannie Mae and Freddie Mac issue these, but they don’t come with the guarantees that agency MBS does. Instead, they are specifically issued to transfer the credit risk onto the holder.
DLY Top Ten Holdings (DoubleLine)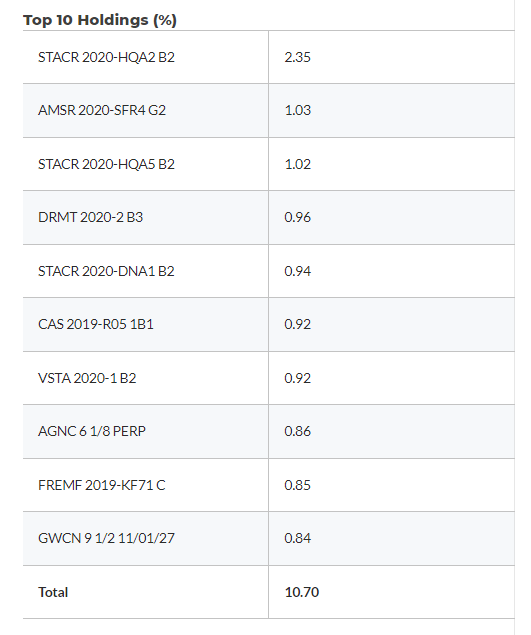
Since our prior update, the weightings have stayed mostly flat. Previously these two non-agency categories constituted around 37% of the portfolio, while it’s just under 36% now. High-yield corporates were 19.2%, which has slid down to 18.5% now. Collateralized loan obligations (“CLOs”) were 13.6% and have now nudged up slightly to 14.3%.
The CLO exposure, which is pooled senior/bank loans, is where the fund’s going to get its floating rate exposure. This also means their bank loan exposure of 9.1% is also providing floating rate exposure. Additionally, when seeing a full breakdown of their portfolio, the majority of their MBS exposure is also at floating rates. That’s why when interest rates were rising, despite higher leverage costs and lower utilization of leverage, the actual earnings of the fund stayed relatively flat.
A pause in interest rate hikes from the Fed or even cuts at some point should benefit the fund through appreciation in their underlying portfolio. It could see the underlying discount on their portfolio start to narrow. However, it wouldn’t necessarily be a huge benefit to providing more income generation since it’s pretty well balanced, as reflected in the prior annual report. To see this happening, we can take a look at some of their financial highlights. Specifically, looking at the total expense ratio rising but also see the NII ratio rise too.
DLY Income/Expenses Ratios (DoubleLine)
Conclusion
Higher rates have impacted DLY, but the fund’s income generation took only a marginal hit thanks to its floating rate exposure. That was even as the fund deleveraged through the prior fiscal year. The fund carries a rather mild amount of leverage overall, but that still increases risks on its riskier portfolio of debt. That could become especially apparent in a recession with the fund’s riskier below-investment-grade portfolio of debt instruments. The fund’s discount has also narrowed some since our last update. That being said, the discount on the underlying portfolio as well as the fund’s discount, appears still to be quite an attractive level to consider.
Read the full article here


